
The Kanban Method for MSPs: principles, practices and a board on your PSA
· Wim Kerkhoff and Diana Fajardo · Kanban

Most MSPs can’t see their own work. The PSA holds every ticket and project task, but spread across queues, boards and screens, so nobody can say at a glance who is working on what, what is stuck, or what comes next. Managers spend their day asking for updates, and problems surface when a client complains.
Kanban fixes that by putting all the work on one visual board and letting the team pull the next job when they have room for it. This guide covers where the method comes from, its principles and practices, how to set up a board for an MSP service desk or project team, and the numbers that tell you whether it is working.
Where Kanban comes from
Kanban started in Toyota’s factories as a way to run just-in-time manufacturing: a card signalled that a station had room for more parts, so nothing was built before it was needed. The method was later adapted for knowledge work, where the “parts” are tasks and the stations are the steps a ticket or project goes through. Kanban’s history has the longer story.
What hidden work costs an MSP
Each role feels the same problem differently.
Owners can’t see which services make money, where tech time goes, or which clients are drifting toward the door because of slow service. Every growth decision rests on guesses.
Service managers juggle uneven workloads: some techs are buried while others wait for work. Status meetings replace improvement, escalations pile up because nobody knows what is urgent, and SLAs slip.
Project managers lose engineers to help desk emergencies, absorb scope creep, and miss dates because estimates and dependencies live in people’s heads.
Clients see the result: response times that vary from one tech to the next, projects that stall without explanation, and updates that only arrive after they ask.
The four principles
The Kanban Method is a pull system: work enters when the team has capacity for it, instead of being assigned from the top. It improves the process you already have rather than replacing it, which is why it rests on four principles.
- Start with what you are doing now. Kanban needs no particular setup. You map your current workflow onto a board and improve from there.
- Agree to pursue incremental, evolutionary change. Sweeping changes unsettle teams and damage performance. Small, continuous changes meet far less resistance.
- Respect the current process, roles and responsibilities. There are no organizational changes at the outset. What works today is worth keeping.
- Encourage acts of leadership at all levels. A good idea from the newest tech counts as much as one from a manager. Everyone owns continuous improvement.
The six practices
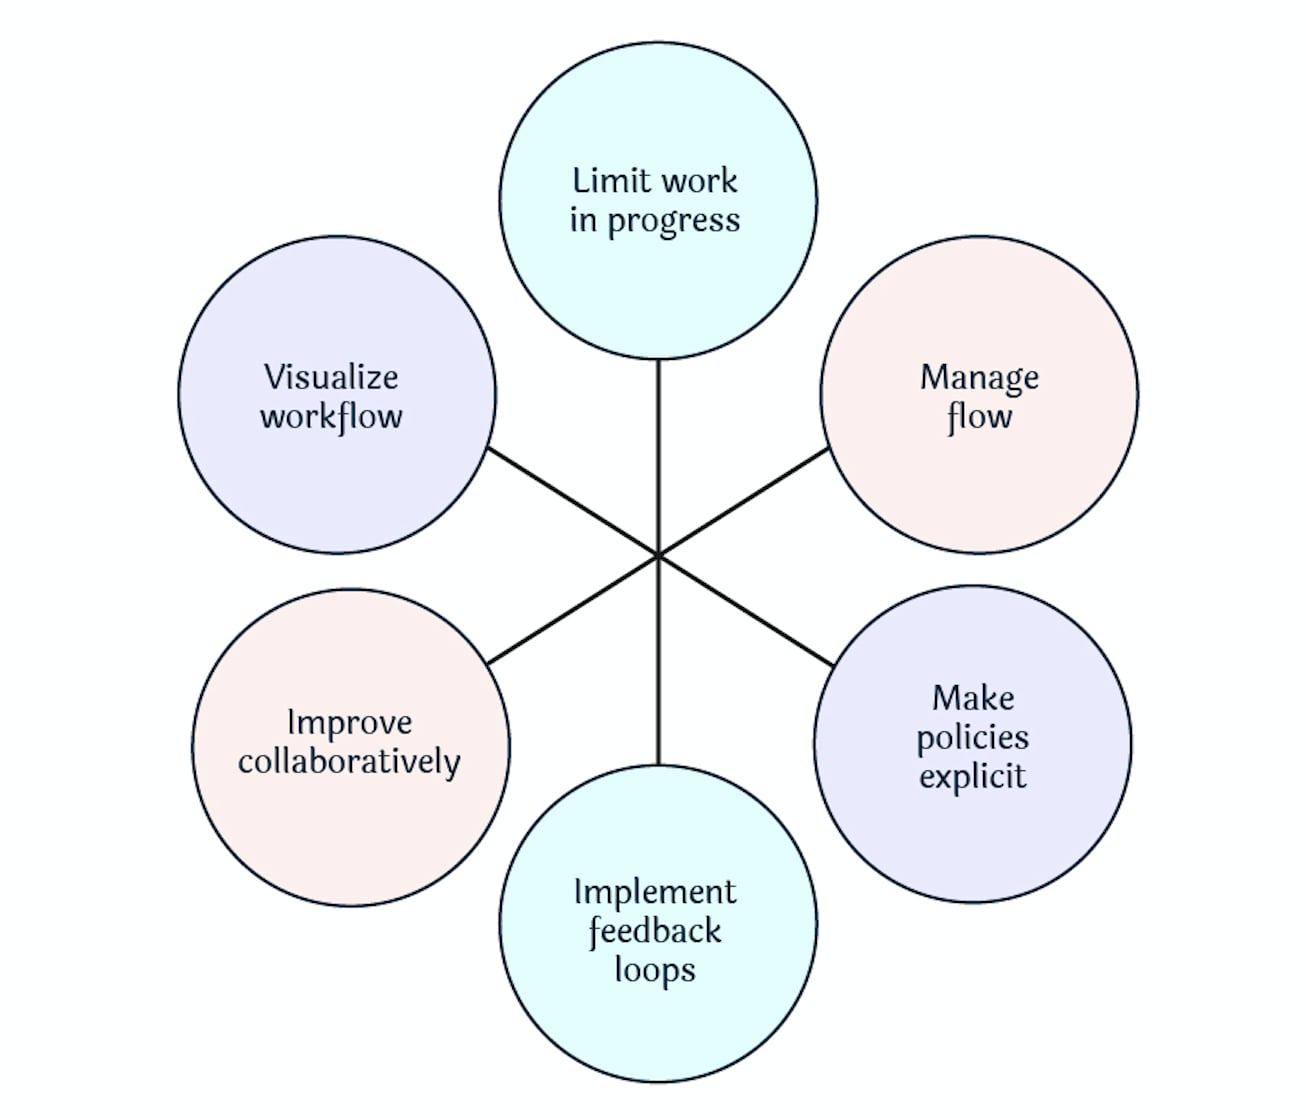
- Visualize the workflow. Each column is a step in your process and each card is a work item. Every card moves from left to right, so progress and bottlenecks are visible as they happen.
- Limit work in progress (WIP). Interruptions and context switching cost a team more than any other habit. WIP limits make the team finish work before starting new work.
- Manage flow. Watch how work moves and where it waits. The goal is a smooth flow with short, predictable lead times (from the client asking to the work being done).
- Make process policies explicit. Write down what each column means and when a card may move. When everyone knows the rules, anyone can suggest a better one.
- Use feedback loops. Short, regular meetings at a fixed time, such as a daily huddle at the board, keep everyone working from the same picture.
- Improve collaboratively. Try one change, measure what it did, and keep it or drop it. Shared understanding of the process makes it much easier to agree on the next change.
Is Kanban right for your team
Kanban fits well when some or all of these are true:
- Your workflow basically works but could be smoother.
- Work stalls and backlogs (lists of work waiting to start) build up.
- You would rather improve the current process step by step than impose a new system.
- Priorities change on short notice, which describes most service desks.
- Responding to clients quickly is the top priority.
Setting up a board at an MSP
Start with a few columns
Begin with columns that match how work moves today. Four or five is plenty:
- New: tickets and tasks waiting to start, ranked by priority.
- In progress: work a tech is actively doing.
- Waiting on client: work that can’t move until the client replies or approves.
- Done: finished work, ready to close and bill.
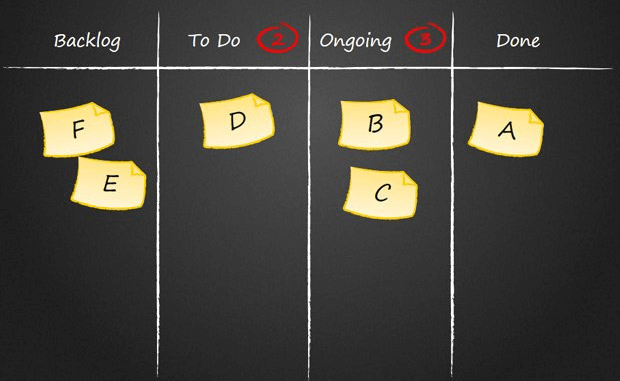
Add columns only when the simple version stops telling you what you need to know. Boards with a dozen columns and card types get abandoned.
Make it a pull system
Overload usually starts when managers push work at people. Everyone starts more than they finish, and multitasking and context switching mean little gets done. (Try the multitasking game with your team to feel the cost.)
In a pull system, the manager ranks the work in the New column, and a tech pulls the top card when they have a free slot. That moment is the commitment point. Until then, the manager can reorder anything, so the team is always working on what matters most.
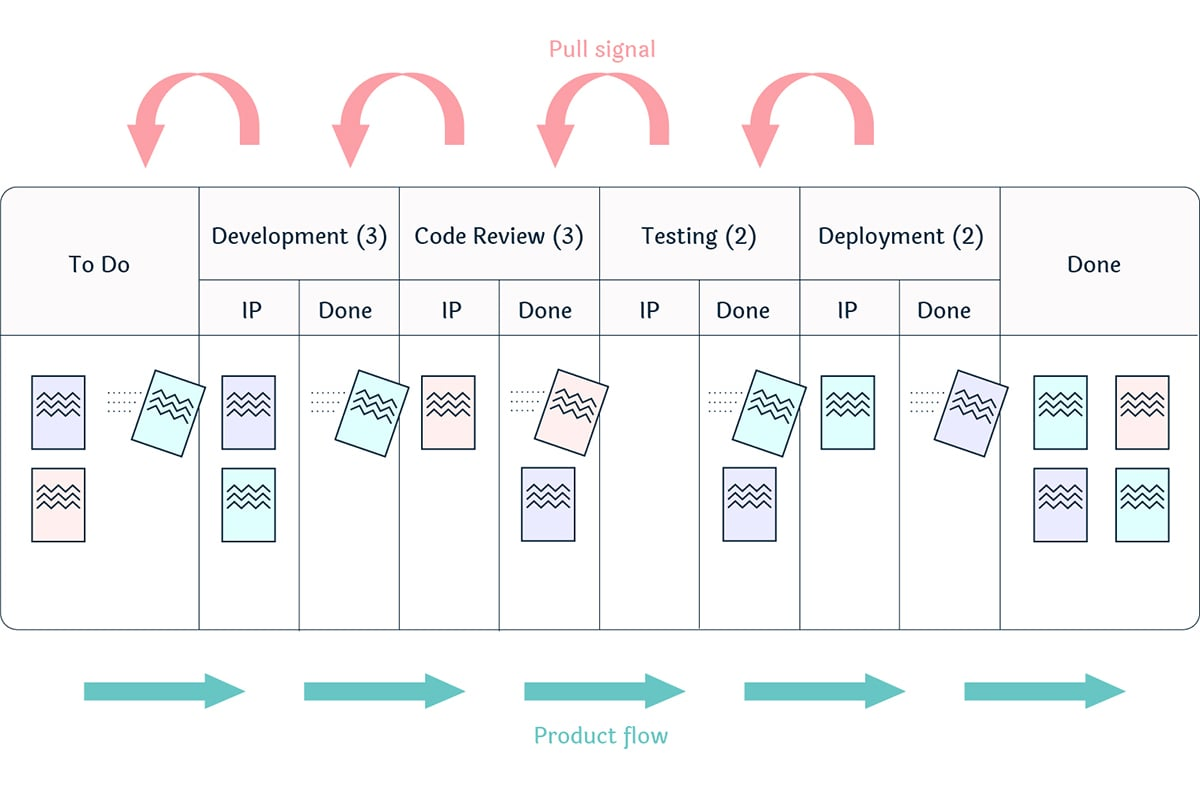
Pull vs. push goes deeper on why assigning work fails at most MSPs.
Set WIP limits
Limit how many cards each person or column can hold. A common start is three cards In progress per tech. When someone hits the limit, they finish or unblock something before pulling more. Limits keep the team from being overloaded while making sure nobody sits idle. How WIP limits improve workflow covers how to choose them.
Hold a short daily huddle
Ten minutes at the board each morning: what’s blocked, what’s at risk of breaching an SLA, who needs help. Moving cards in the huddle (a 10 to 15 minute meeting at the board) keeps the board current, which is the most common thing that goes wrong.
Put the board on top of your PSA
The board only works if it reflects the real work. For an MSP that means the PSA’s tickets and project tasks, not a copy in a separate tool. General tools such as Trello, Asana, Jira and Azure DevOps make good Kanban boards but don’t connect to a PSA, so techs end up entering time and status twice.
TopLeft puts Kanban boards on top of ConnectWise, Autotask and HaloPSA. Cards are your PSA tickets and tasks, moving a card updates the PSA, and time entries and billing stay where they are.
Reading the board
The board shows problems while they are still small:
- Cards piling up in Waiting on client: follow up with clients before SLAs slip.
- Cards stuck in a review column: the reviewer needs help or time.
- A New column that keeps growing: demand is outrunning capacity; reprioritize or move people.
- One tech’s lane overflowing while another’s is empty: rebalance before someone burns out.
Measuring flow
Five numbers tell you whether Kanban is working:
- Lead time: from ticket creation to done.
- Cycle time: from when work starts to done.
- Throughput: how many items the team finishes per week or month.
- Work in progress: how many items are open per tech.
- Blocked items: how many are waiting on someone outside the team.
An MSP guide to Kanban throughput explains the most useful of them. Beyond the raw numbers, a few charts show the shape of your flow.
Cumulative flow diagram
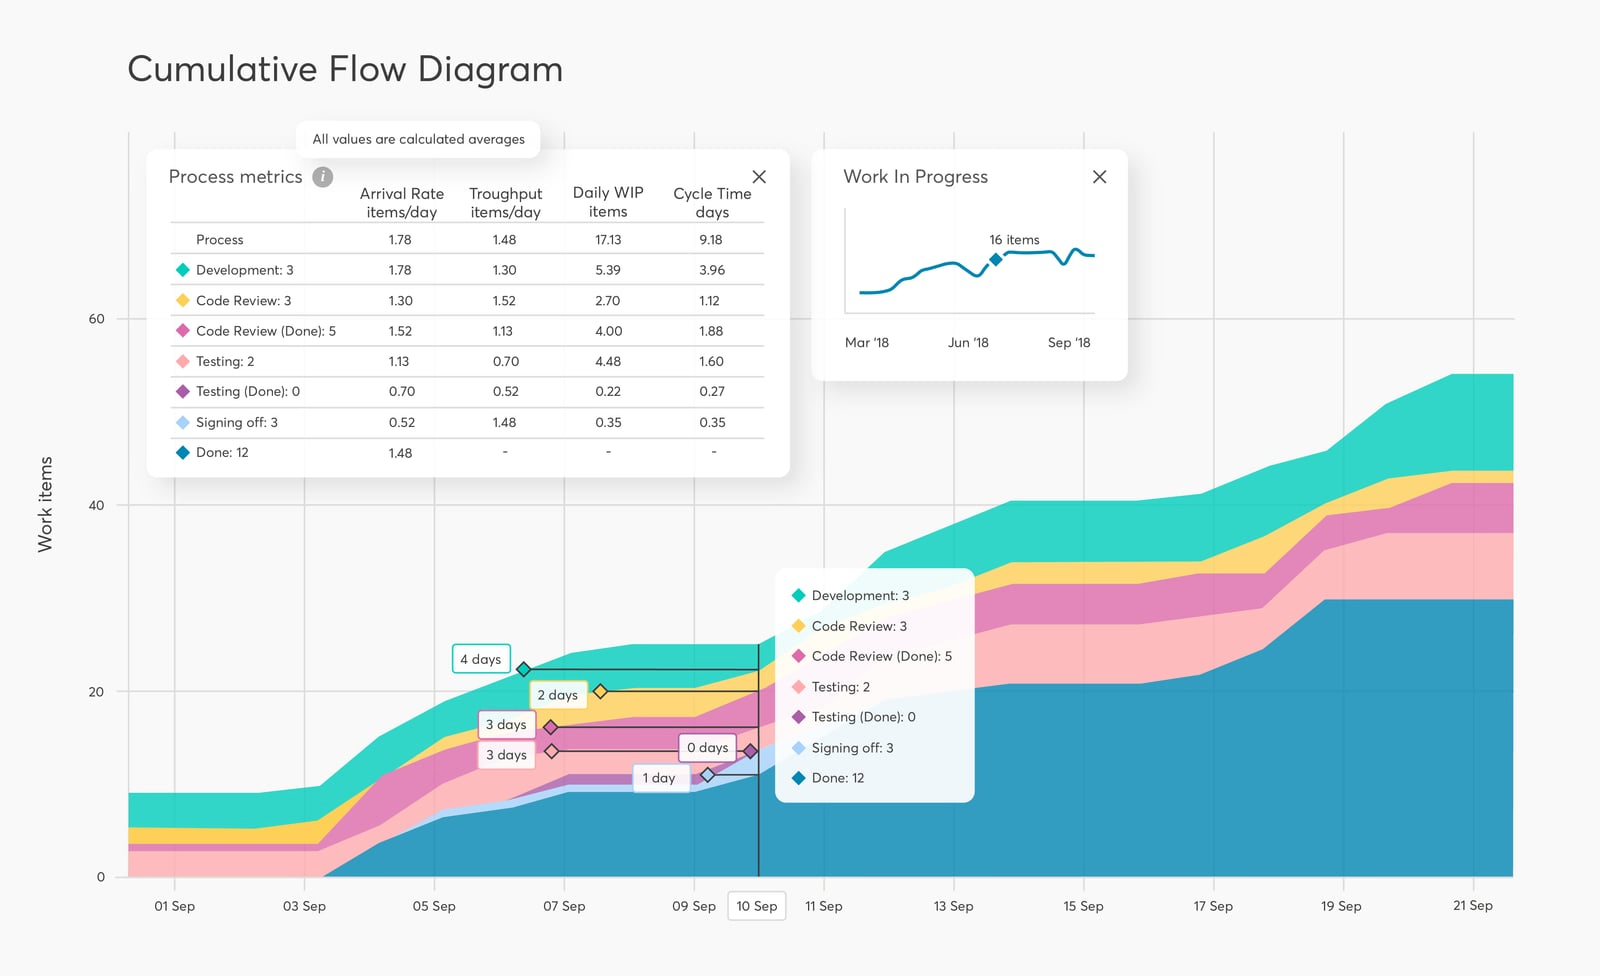
The cumulative flow diagram stacks the number of items in each column over time. Bands that stay even mean a stable flow; a band that widens shows where work is piling up.
Cycle time scatterplot and histogram
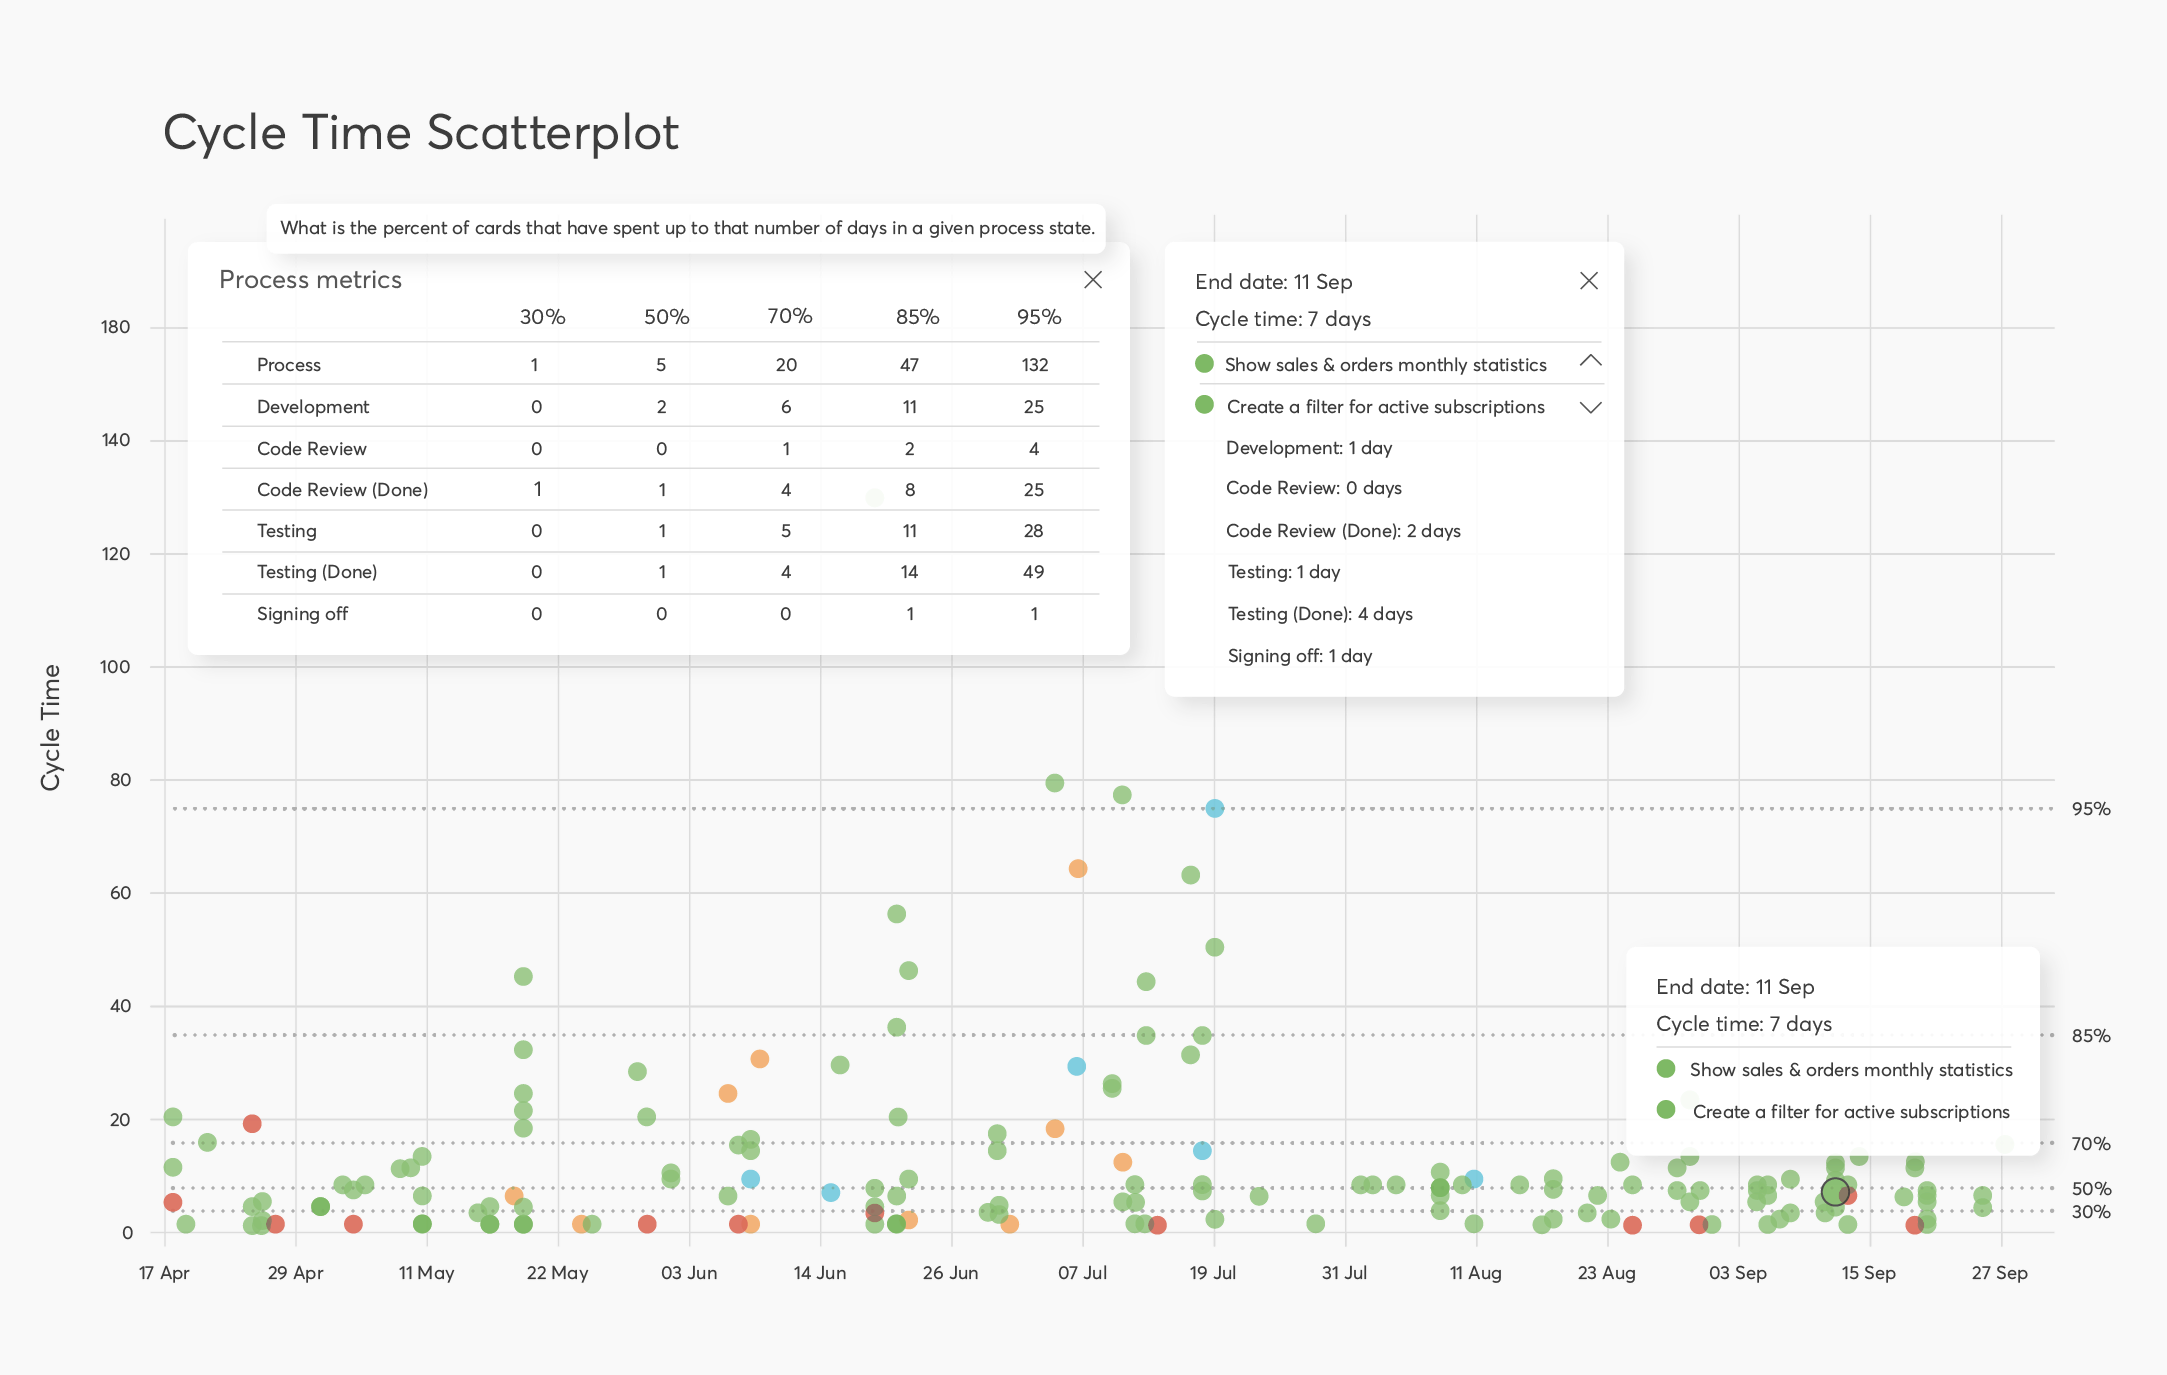
The scatterplot plots each finished item by how long it took, so outliers stand out and you can forecast how long similar work will take. The histogram shows the spread: a wide spread means an unpredictable process.
Throughput histogram and run chart
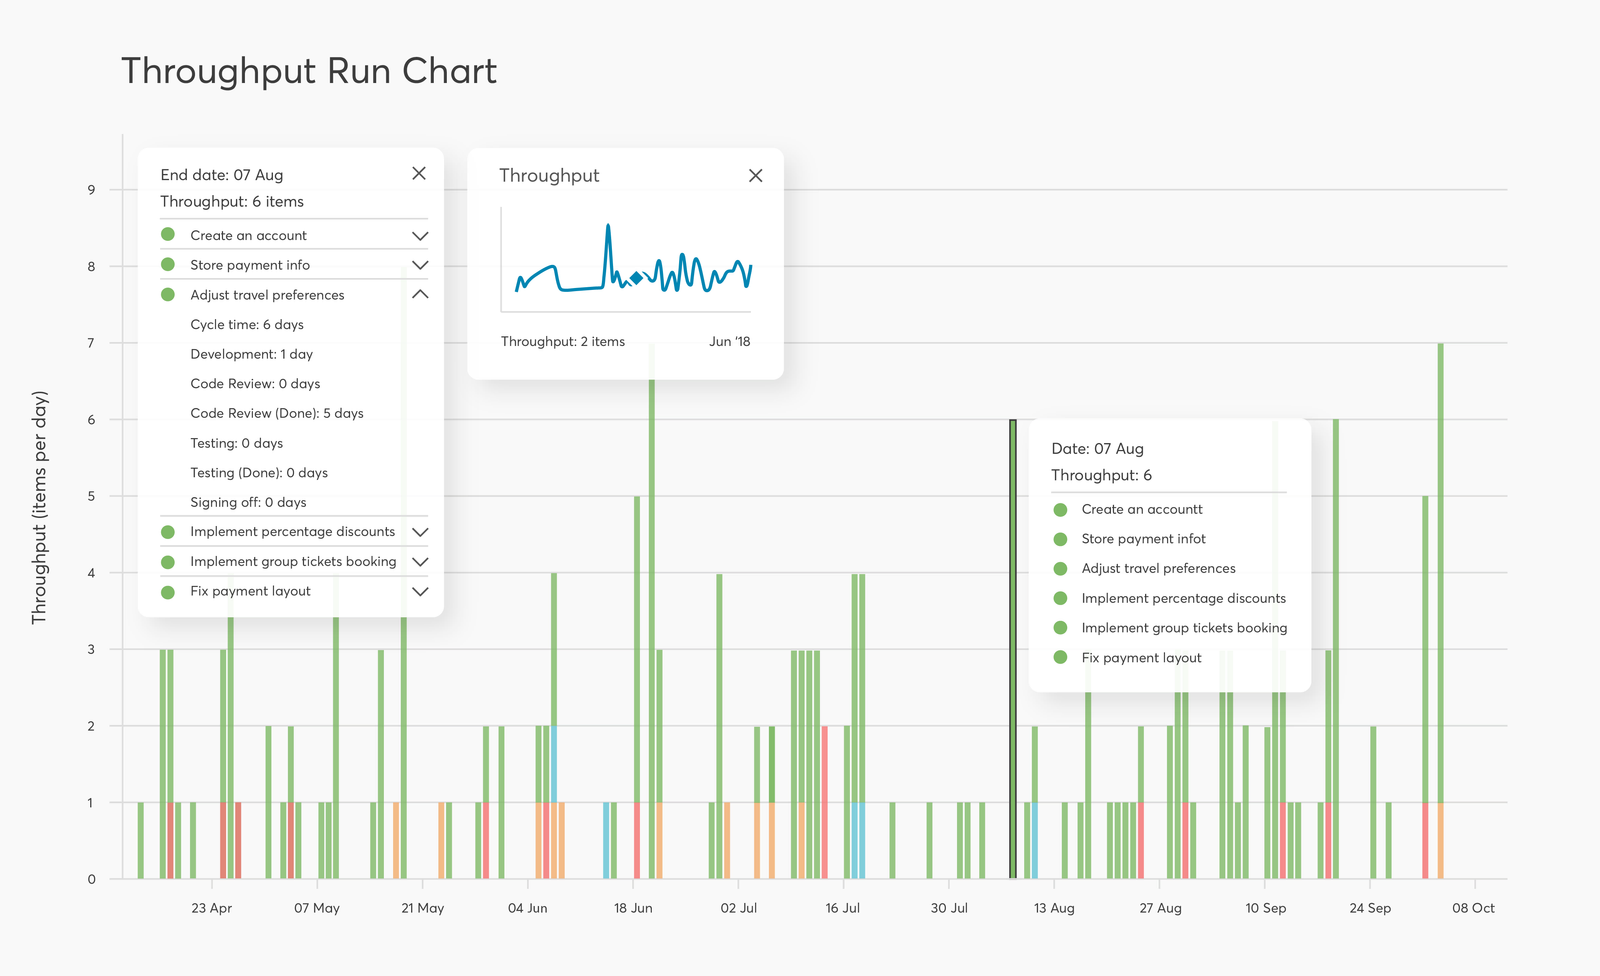
The throughput histogram and run chart show how consistently the team delivers week to week. The closer the values, the more predictable the process.
Aging chart
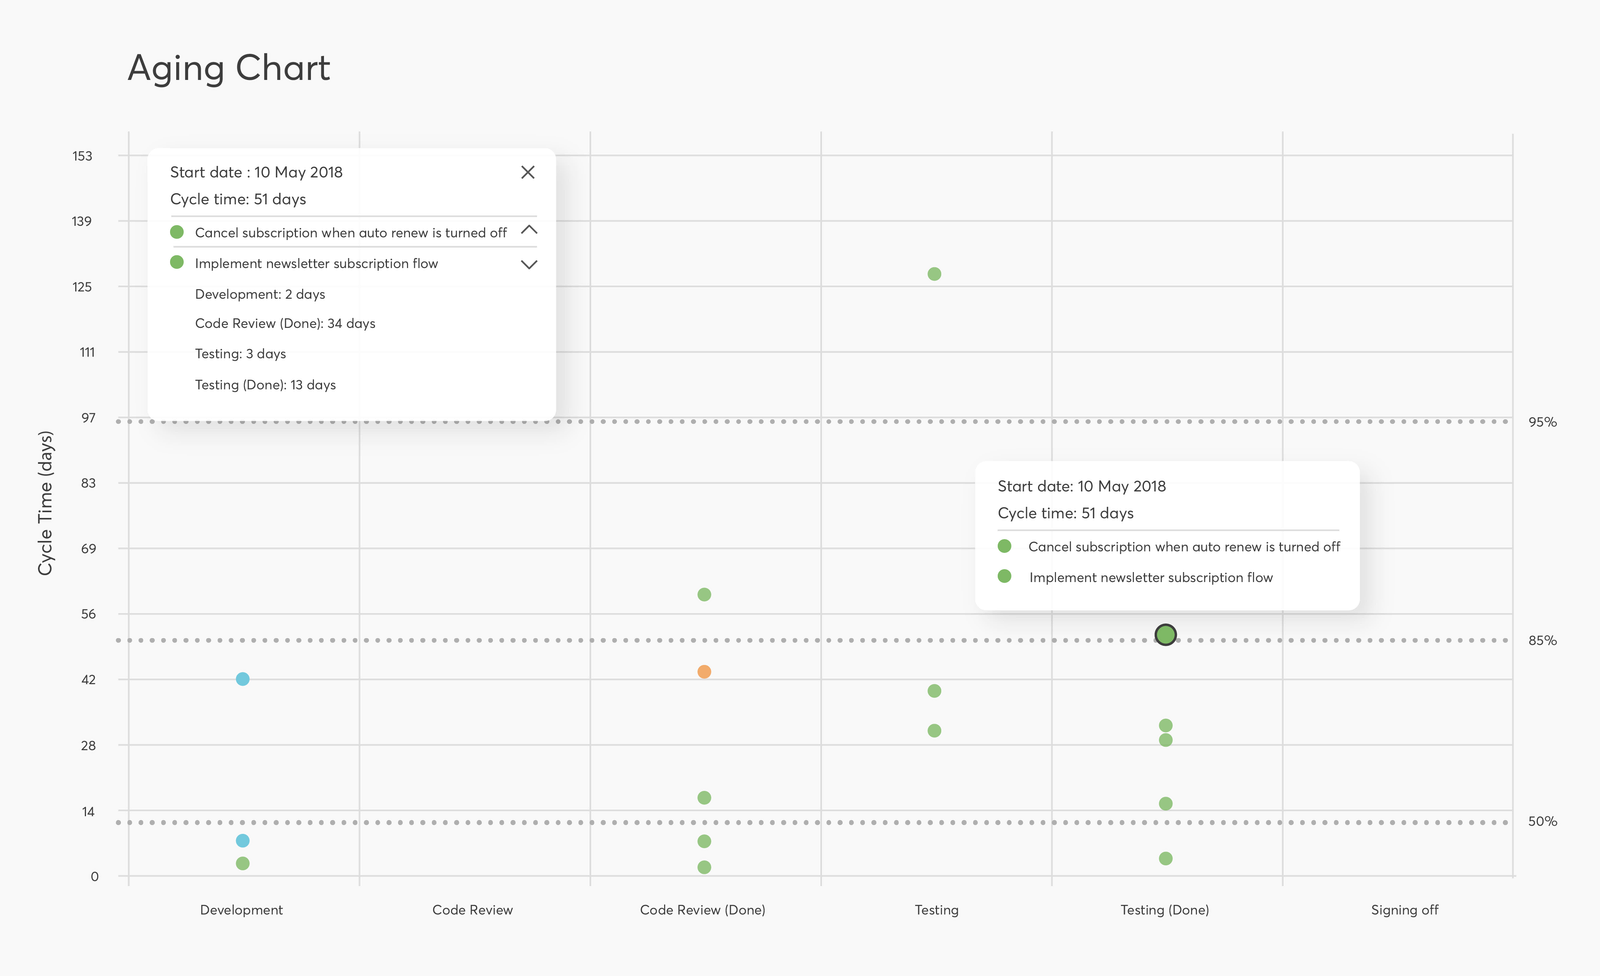
The aging chart shows how long each open item has been in its current column. The older an item gets, the more likely it is to be late.
TopLeft boards can upload to Nave every night, and Nave draws these charts from them. Nave is a separate subscription.
Common problems when starting
Techs resist the change. Some prefer the PSA screens they know. Start with volunteers and let them show the rest of the team what changed. The champions playbook covers how.
The board gets too complicated. Start with four or five columns and add more only when the simple board stops answering your questions.
The board goes stale. Cards that nobody moves make the board useless. Moving cards in the daily huddle takes a few minutes and keeps it honest.
What it looks like in practice
At Seitel Systems, active tickets per tech went from 34 to 11 in three months with better prioritization. Black Tip IT keeps its average response time under three minutes across all clients, with priorities visible on the board.
Kanban or Scrum
Both break large, complex work into manageable pieces and keep the team looking at the same picture. Scrum works in fixed sprints (a fixed stretch of work, usually two weeks) with set roles and ceremonies. Kanban has neither: you keep your structure and improve the flow you have. For a service desk, where new work arrives every hour and priorities change on short notice, that usually makes Kanban the easier fit.
Next steps
- Feel the cost of multitasking with the multitasking game.
- Set your first WIP limits.
- Start a daily huddle.
To see Kanban boards running on ConnectWise, Autotask or HaloPSA, book a demo.