Skip to content
  • There are no suggestions because the search field is empty.

What BrightGauge Can’t Show You (And Why TopLeft Is Better)

BrightGauge excels at showing what already happened, including utilization trends, SLA compliance rates, ticket volume by month, and other historical metrics presented through clean charts, automated reports, and solid data.

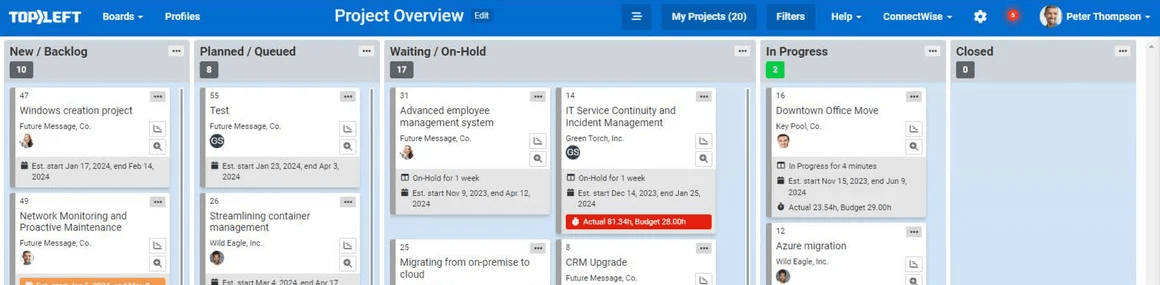
What it can’t tell you is what’s happening right now. Who’s overloaded today. Which critical ticket is sitting untouched because your team can’t see the queue.

Whether you can actually start that new project next Monday or whether you’re already overcommitted. That’s not a reporting problem. That’s a workflow visibility problem, and dashboards don’t solve it.

TopLeft isn’t a replacement for reporting. It’s the real-time workflow layer that reporting tools don’t have.
hero_banner-1-min

Learn how TopLeft compares to BrightGauge

Features
TopLeft
Blank
BrightGauge
Live Kanban boards showing who’s working on what, right now. Drag-and-drop reassignment without leaving the board.
Native two-way sync with ConnectWise, Autotask, HaloPSA. Work items appear on boards automatically.
Built-in view of engineer availability vs. committed work. Overload heatmaps answer “when can we start the next project?” before sales asks.
Technicians pull their next priority from visual queues without waiting for dispatch.
Clear visual prioritization stops cherry-picking. Critical tickets don’t get buried.
Connects to your PSA in 30 minutes. Concierge onboarding gets boards running today.
Native client portal shows ticket and project status in real time. Stops the daily “where’s my project?” call.
Unified board for service tickets and project tasks. Time entry directly from Kanban cards.
Visual indicators on tickets approaching SLA deadlines. Reassign with drag-and-drop before they breach.
Technicians, coordinators, project managers, and service managers managing daily client work.
Workflow Visibility
PSA Integration
Capacity Planning
Team Adoption
Priority Management
Setup Time
Client Communication
Daily Workflow
SLA Visibility
Target User
Historical KPI dashboards. Shows what happened last week.
Pulls PSA data for reporting. Doesn’t manage daily workflow.
Calculated utilization metrics for after-the-fact analysis.
Managers view dashboards. Technicians still work from PSA lists.
Shows ticket age metrics. Doesn’t direct what to work on next.
Requires gauge configuration, chart customization, and dashboard setup.
Embedded gauges for displaying public metrics on websites.
Not applicable. BrightGauge displays data but doesn’t manage ticket assignment or time logging.
Historical SLA compliance metrics and trend analysis.
MSP owners, executives, and account managers measuring historical performance.
Collapse

Which Tool Fits Your Situation

TopLeft is the right fit when your problem is operational, not analytical.

Your techs are working from PSA lists and nobody can see who’s actually busy. Work falls through the cracks because there’s no shared view of the queue. A senior engineer is buried while two others wait for dispatch to tell them what’s next.

TopLeft puts every ticket and project task on one visual board, synced live with ConnectWise, Autotask, or HaloPSA. Technicians pull their next priority without waiting for someone to assign it. Service managers can see overloads in seconds instead of finding out when an SLA slips

operational problems msp
TopLeft is the right fit when you’re committing to work you can’t actually deliver.

Sales closes a new project. You say yes. Then Friday afternoon arrives and somebody realizes the team is already committed to three other things that week.

The built-in capacity view shows engineer availability against scheduled work before you make the commitment. The native client portal shows clients their ticket and project status in real time. It stops the daily status calls without anyone having to send a manual update.

Capture-3
Reports and Dashboards (BrightGauge) is the right fit when your problem is analytical.

You need polished QBR reports. You want automated monthly charts showing SLA trends, technician utilization ratios, and ticket volume over time. Your leadership team needs to measure business health or demonstrate value to clients with data.

BrightGauge does that well. But it shows you what already happened. It doesn’t help you answer who should work on this ticket right now, or whether you can take on another project this month.

brightgauge

TopLeft is the right fit when your problem is operational, not analytical.

Your techs are working from PSA lists and nobody can see who’s actually busy. Work falls through the cracks because there’s no shared view of the queue. A senior engineer is buried while two others wait for dispatch to tell them what’s next.


TopLeft puts every ticket and project task on one visual board, synced live with ConnectWise, Autotask, or HaloPSA. Technicians pull their next priority without waiting for someone to assign it. Service managers can see overloads in seconds instead of finding out when an SLA slips.

operational problems msp

TopLeft is the right fit when you’re committing to work you can’t actually deliver.

Sales closes a new project. You say yes. Then Friday afternoon arrives and somebody realizes the team is already committed to three other things that week.


The built-in capacity view shows engineer availability against scheduled work before you make the commitment. The native client portal shows clients their ticket and project status in real time. It stops the daily status calls without anyone having to send a manual update.

Capture-3

Reports and Dashboards (BrightGauge) is the right fit when your problem is analytical.

You need polished QBR reports. You want automated monthly charts showing SLA trends, technician utilization ratios, and ticket volume over time. Your leadership team needs to measure business health or demonstrate value to clients with data.


BrightGauge does that well. But it shows you what already happened. It doesn’t help you answer who should work on this ticket right now, or whether you can take on another project this month.

brightgauge

What Customers Are Saying

Testimonials_frank
star
We manage a lot of Projects (40–60 at a time) and TopLeft has proven to improve focus and save time capturing critical information needed to keep projects on schedule!
— Frank Hannaford
Solutions Architect
at CoreTech
Testimonials_Chase-1
star
We transitioned from ConnectWise Manage to TopLeft for better ticket management. We improved SLA adherence from 60% to 90% within six months.
— Chase Effler
Engineering Manager
at Appalachian Network Services Inc.
steve-1
star
Moved from negative to positive 58% project efficiency, finishing projects with 1/3 time left over.
— Steve Psaradellis
CEO
at TEBA

See It In Action

Get a personal tour of how PSA-integrated Kanban boards give your team a shared view of the work so you stop finding out about overloads and missed SLAs after the fact.