Skip to content
TopLeft

Make stuck work visible

Most dashboards and reports bury you in data and hide neglected work and overloaded people. Flow metrics and visuals show your team where work is stuck, so it keeps moving with less drama and fewer meetings.
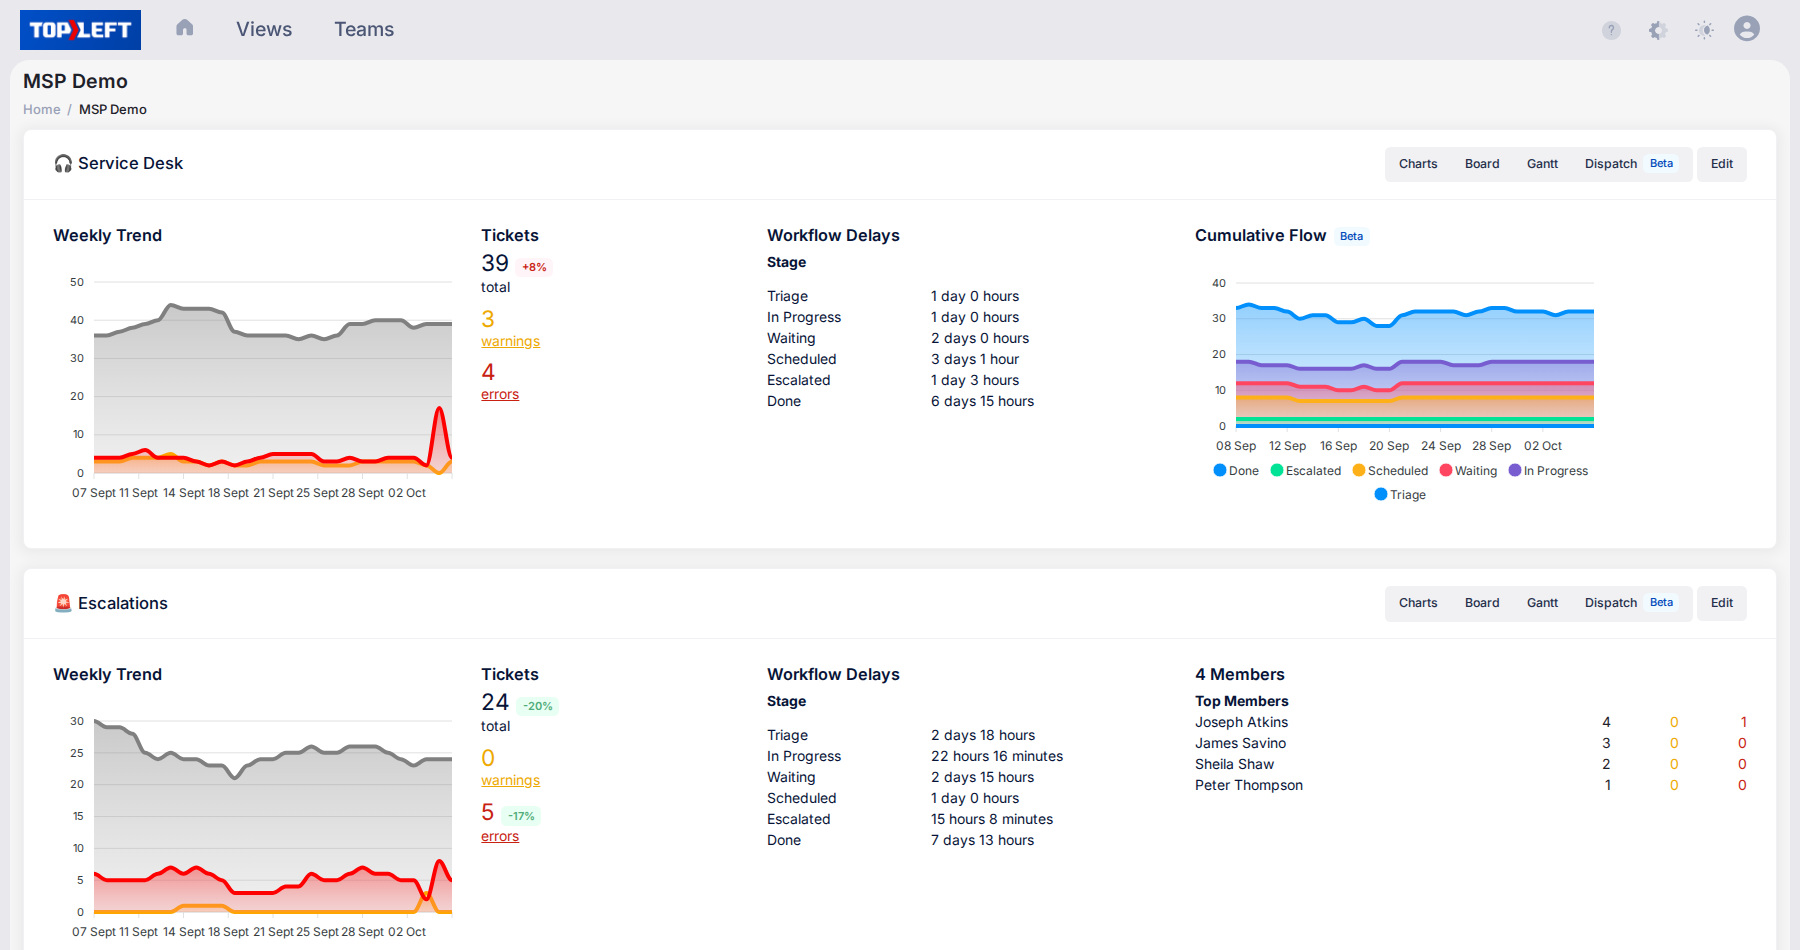
TopLeft team dashboard with weekly trends, ticket counts, workflow delays per stage and cumulative flow for the service desk and escalations boards

Used by 700+ MSPs

TEBASeitel SystemsAppalachian Network ServicesClear GuidanceKelley ConnectVersaTrust

See problems before they impact clients

Proactively prevent issues with visual alerts that surface what needs attention before it becomes urgent.

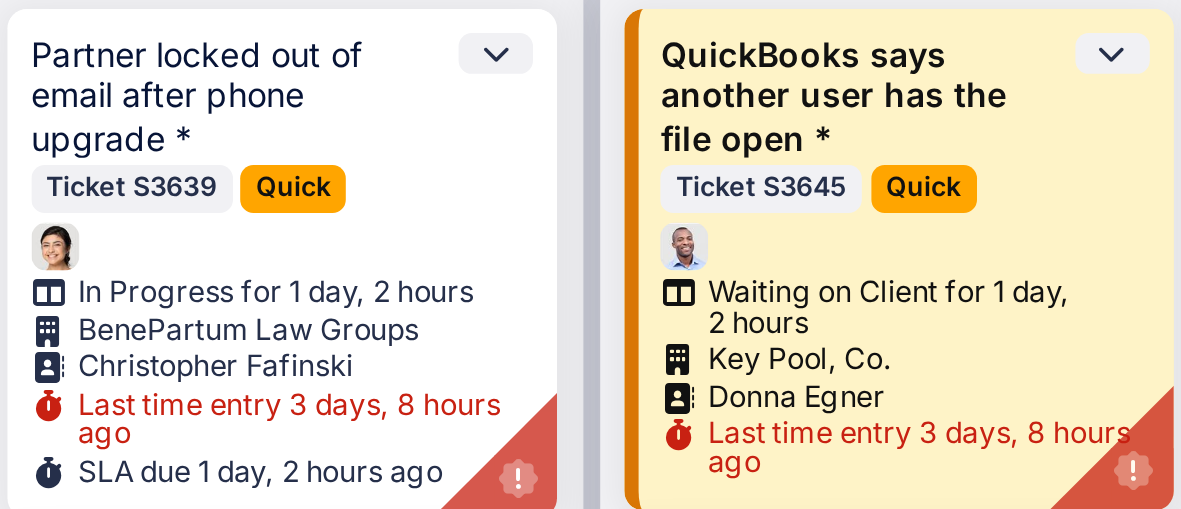
  • Spot SLA risks early with deadline-based visual cues
  • Instantly recognize high-priority work with color-coded cards
  • Uncover workflow bottlenecks using column-level metrics
  • Stay in sync with real-time PSA updates, no manual work needed
  • Monitor technician capacity at a glance to avoid burnout
Book a demo
TopLeft cards flagged red because their last time entry was more than three days ago

Share the right view with clients and your team

Give clients clarity without oversharing, control what they see while keeping sensitive info secure.

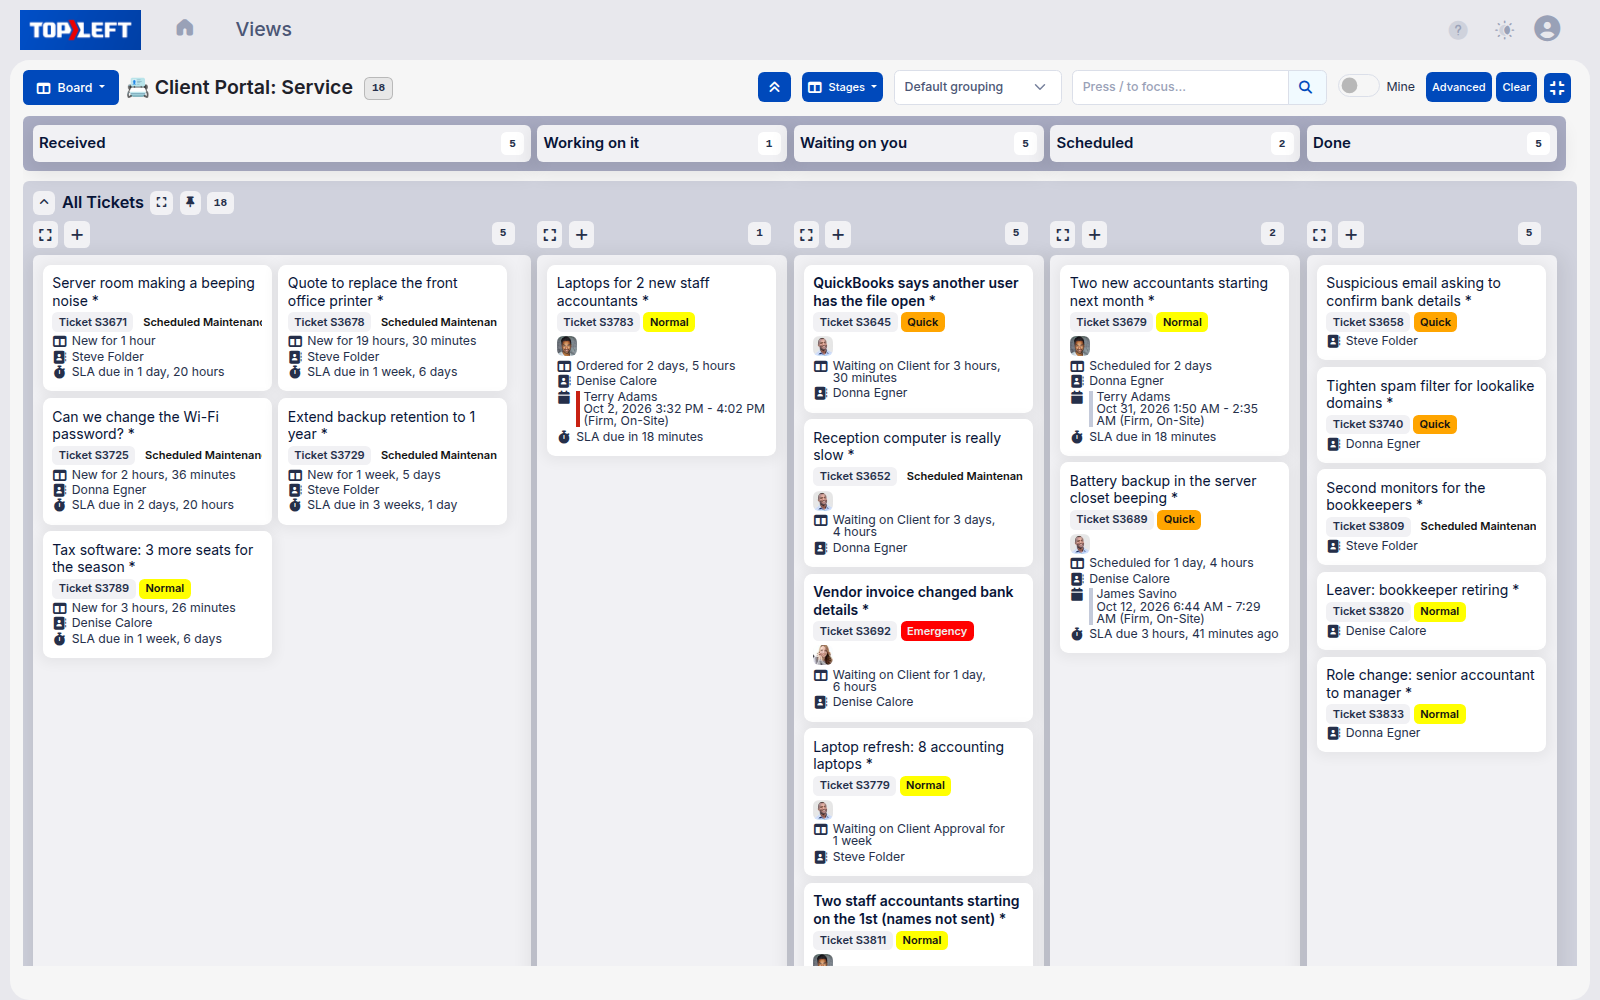
  • Share tailored client-facing boards with relevant statuses only
  • Customize views to match each client’s needs
  • Reduce time spent on status emails and meetings
  • Maintain transparency without compromising security
See the client portal
A client's view in the TopLeft client portal: only their company's tickets, on a board with columns Received, Working on it, Waiting on you, Scheduled and Done

What MSPs say

★★★★★

“In TopLeft, when you're going through the dispatching process, it actually shows you availability on the employee's calendar, whereas in ConnectWise it doesn't. The employees have gotten better about not double booking, which was a big deal a while ago.”
Read the full story

Chase Effler

Engineering Manager, Appalachian Network Services

Supporting your implementation every step of the way

Onboarding starts with Launch: four sessions with your Customer Success Manager over 4 weeks, covering board setup, team training and daily huddle coaching. Teams of 10 or more with several departments can go further with Optimize.

If you want to pace the change yourself, 12 Weeks to Kanban is a free series in our help centre, one practice a week.

See implementation services

Questions MSPs ask

What information does the TopLeft Dashboard provide about our teams' workflows?
The TopLeft Dashboard gives you comprehensive visibility into your workflow metrics and team performance across all Kanban boards. You can track card volume trends over the past four weeks, monitor the current count of warning and error cards, identify workflow delays by seeing the average time cards spend in each column, and quickly spot which swimlanes (rows that group cards, for example by client, technician or project) contain the most cards. This historical context makes it easy to identify patterns, spot bottlenecks, and make informed decisions about resource allocation and process improvements without having to dig through multiple reports or systems.
Can engineers focus only on their assigned work using the Dashboard?
Yes! The "Open Mine" button on the Dashboard is specifically designed for this purpose. When engineers click this button, they're taken directly to a filtered view of the board showing only their assigned cards. This makes it incredibly easy to focus on personal workloads without the distraction of seeing the entire team's work. The filtered view also loads much faster than the full board, which is especially helpful when working with boards that contain many tickets. Engineers can now use a single swimlane board for both team-wide visibility and personal work management.
How do I access the Dashboard and navigate between different teams' boards?
Accessing the Dashboard is simple. Just click on the TopLeft or your company logo in the main navigation menu. The Dashboard opens to the "My Boards" tab by default, showing metrics for all your teams. To view boards for other teams or boards not assigned to a team, switch to the "All Boards" tab. Each board has convenient navigation links to open the full board, open a filtered view of your assigned work, or edit the board (for managers and administrators only).
Are the Dashboard metrics updated in real-time?
The metrics displayed on the Dashboard are recorded nightly rather than in real-time. However, TopLeft has been recording these metrics already, so you'll have useful historical data available immediately when the feature is enabled. This approach ensures the Dashboard loads quickly while still providing relevant, recent information about your workflows.
How can I choose which board shows detailed metrics for my team?
For each team, one primary board is shown with detailed metrics. By default, this is either the board chosen in the team's configuration or the first board listed for the team in the main menu. If TopLeft doesn't automatically select the most appropriate board, you can manually set the default board on the team's configuration page. This ensures that the most important board for each team gets the detailed metrics display on the Dashboard.
What metrics are shown for non-primary team boards?
For boards that aren't designated as the primary board for a team, the Dashboard shows simplified metrics. These include just the current number of warning cards, error cards, and total cards on the board. This streamlined approach helps keep the Dashboard focused while still providing awareness of potential issues on secondary boards.

See it in action

Get a personal tour of how PSA-integrated Kanban boards give your team a shared view of all their work.

Book a demo

Search the TopLeft site

    Tip: press / on any page to search. Open the search page

    Feedback on this page

    Fix or keep
    What kind

    Tip: select words on the page before you open this, and they come with your note.

    Optional, up to 5. Paste into the box above, or drop them here.

      They go into the GitLab issue. Crop out anything private.

      See every note and what happened to it