
This post is republished with permission from Nave. Nave uses data from TopLeft to make agile charts for analyzing workflow efficiency and identifying areas for improvement in your team. Learn more here.
Even though it’s super simple, this exercise will have you making data-driven time estimates in literally no time.
Hey there friend, I hope you’re having a wonderful week! Today, I’m going to show you how you can make reliable data-driven predictions and make the ultimate shift from struggling to meet your commitments to establishing a faster, easier and much more reliable process of estimating, which will enable you to hit your targets consistently!
By the end of this article, you’ll have learned one of the most reliable approaches to making accurate delivery forecasts, so without any further ado, let’s get started.
The Most Simple Method to Making Reliable Time Estimates
The best way to demonstrate how to make data-driven time estimates is to walk you through a quick exercise. You can immediately use this method – it takes just a few minutes, so make sure you try it out right away!
This exercise will help you come up with a reliable forecast, by using your past performance data alone. And I can tell you, the participants of my Sustainable Predictability program absolutely love doing this! I think you will too.
Ok, so I want you to open your board and take the last 20 to 30 completed work items. Then, open Google Spreadsheet or Excel and put the time needed to finish each of them in a column. You don’t need to be too precise, simply round the number up or down to the nearest day. In the case that there is a task that has taken less than 1 day, keep it to 1.
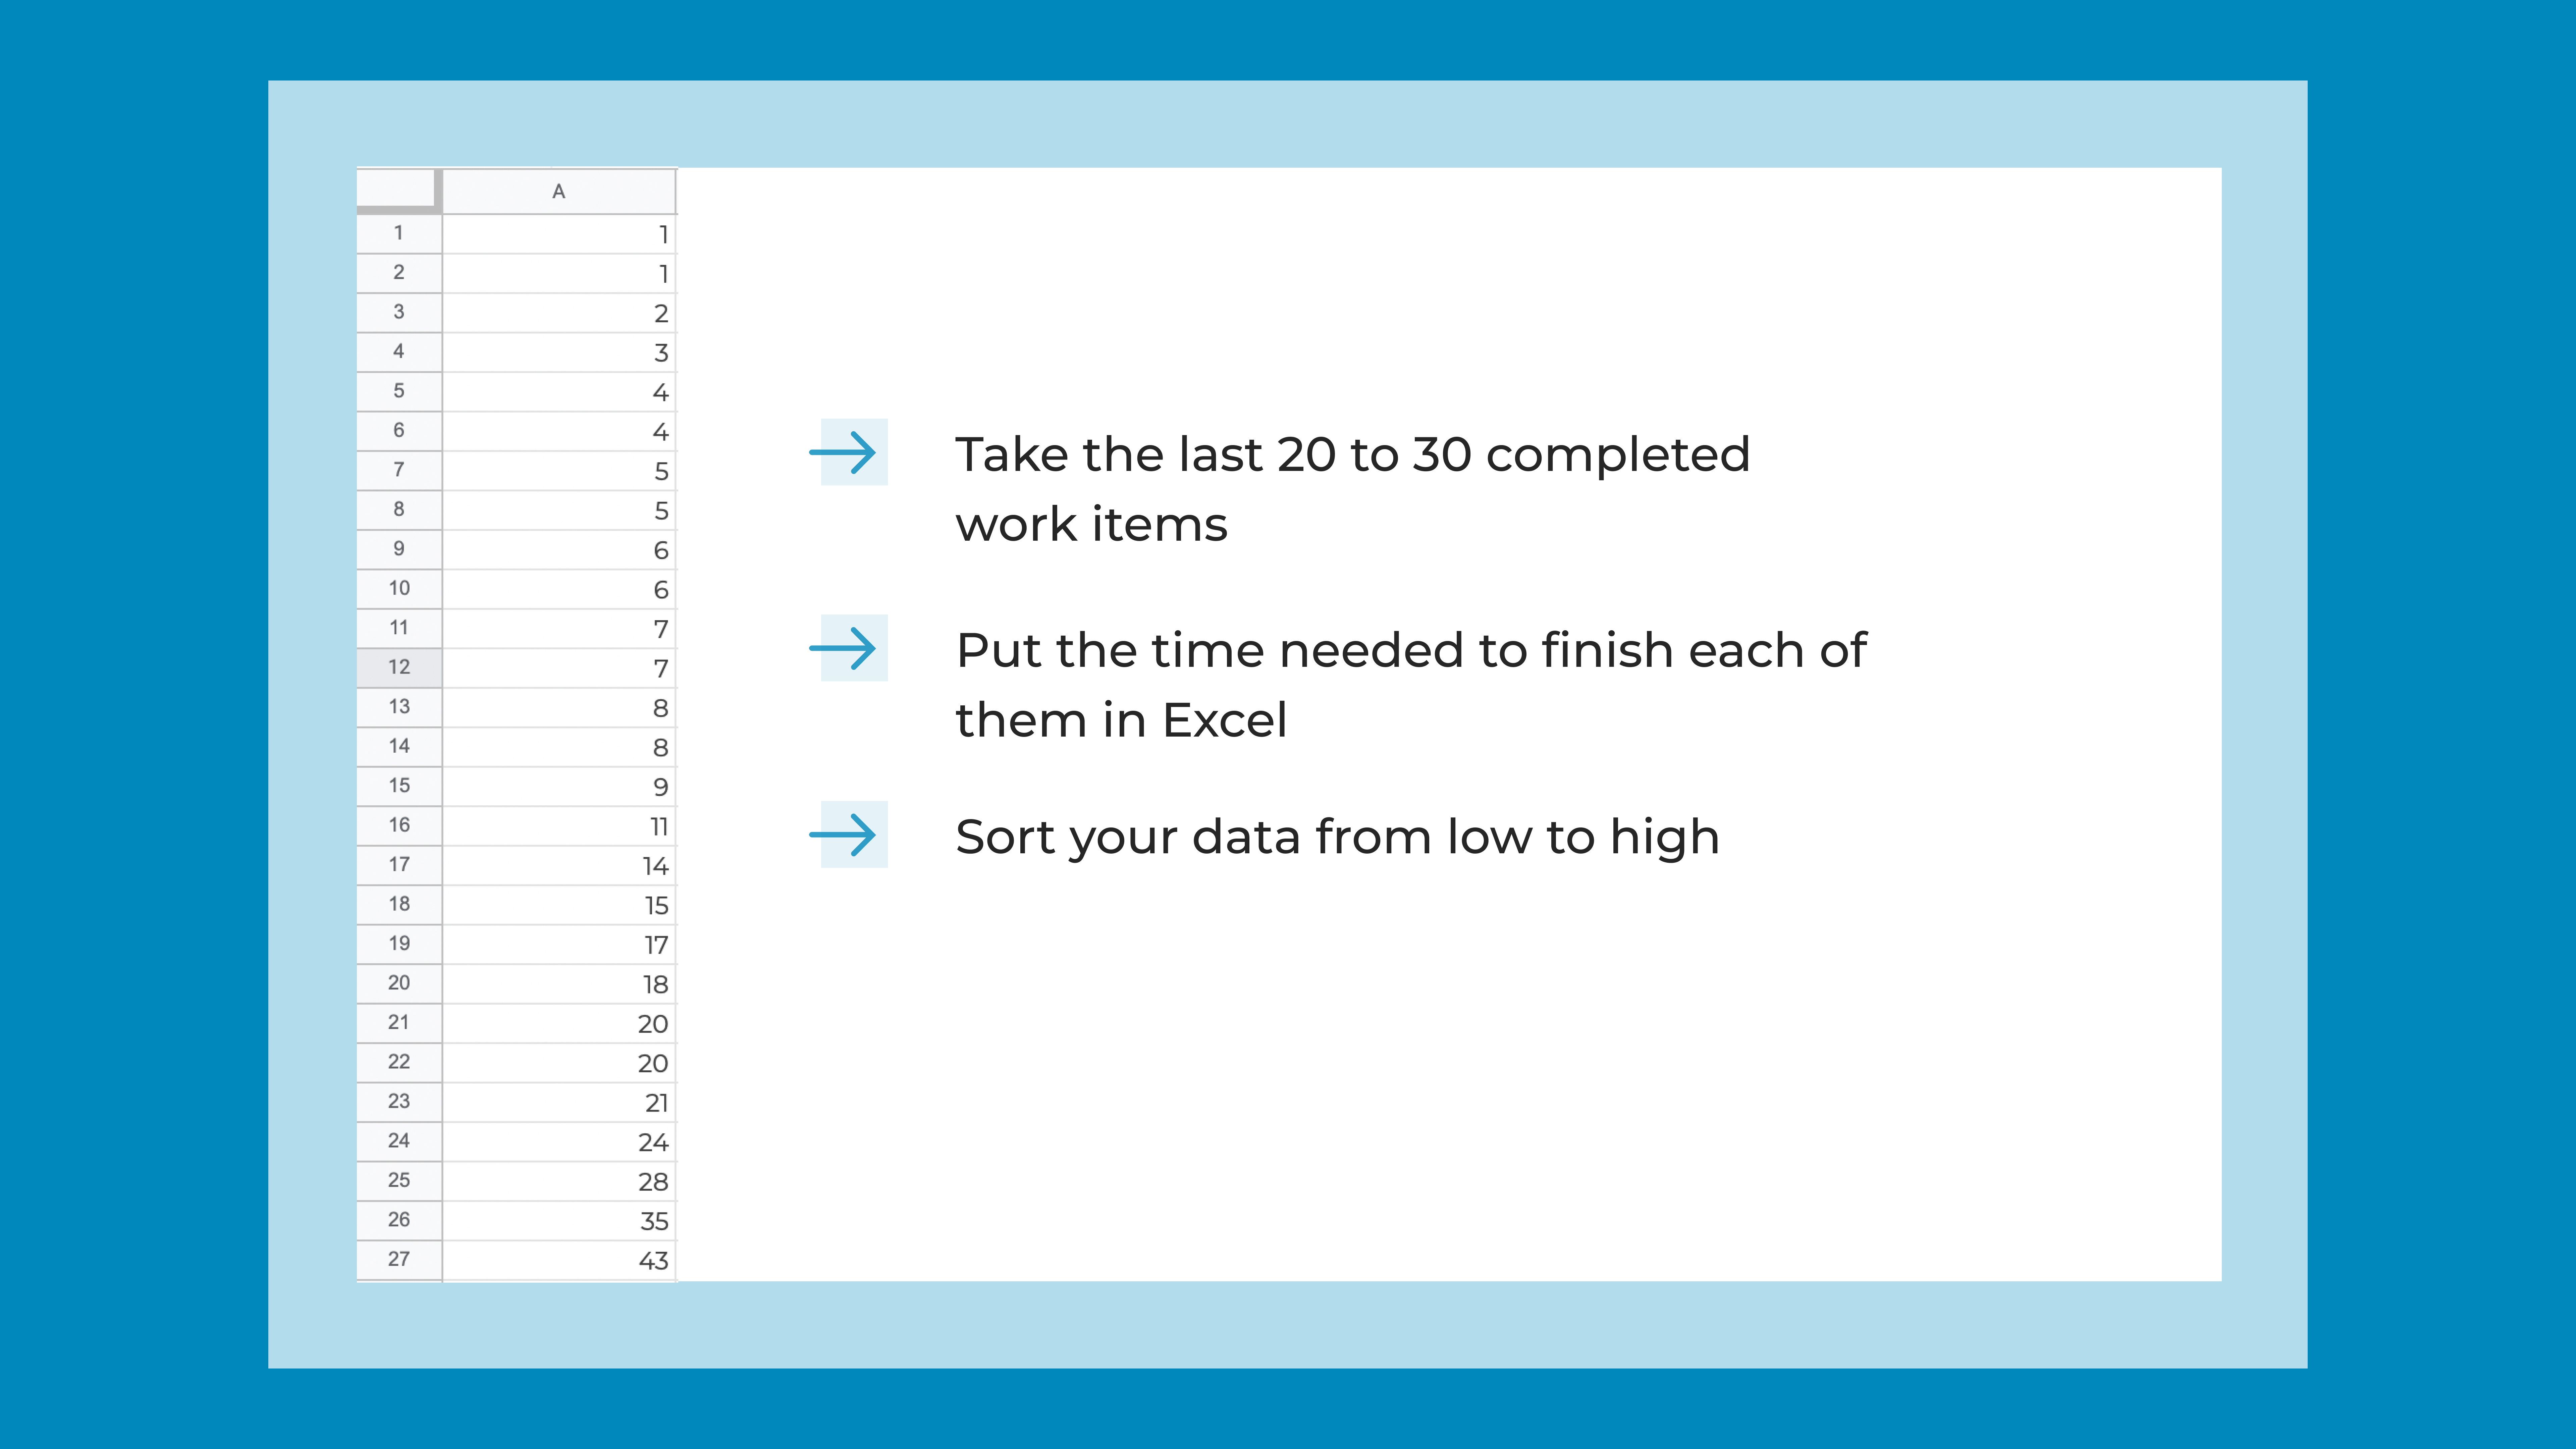
Then, in the spreadsheet, sort your data from low to high. What you now have is a collection of completion times that represent your delivered work ordered from the fastest one to the most time-consuming one.
What I want you to do now is add a table with 4 columns. In the first column, we will count the number of completed items. In the second one, I want you to add 4 values – 50%, 70%, 85% and 95%. We will use these values to define the probability of your time estimates.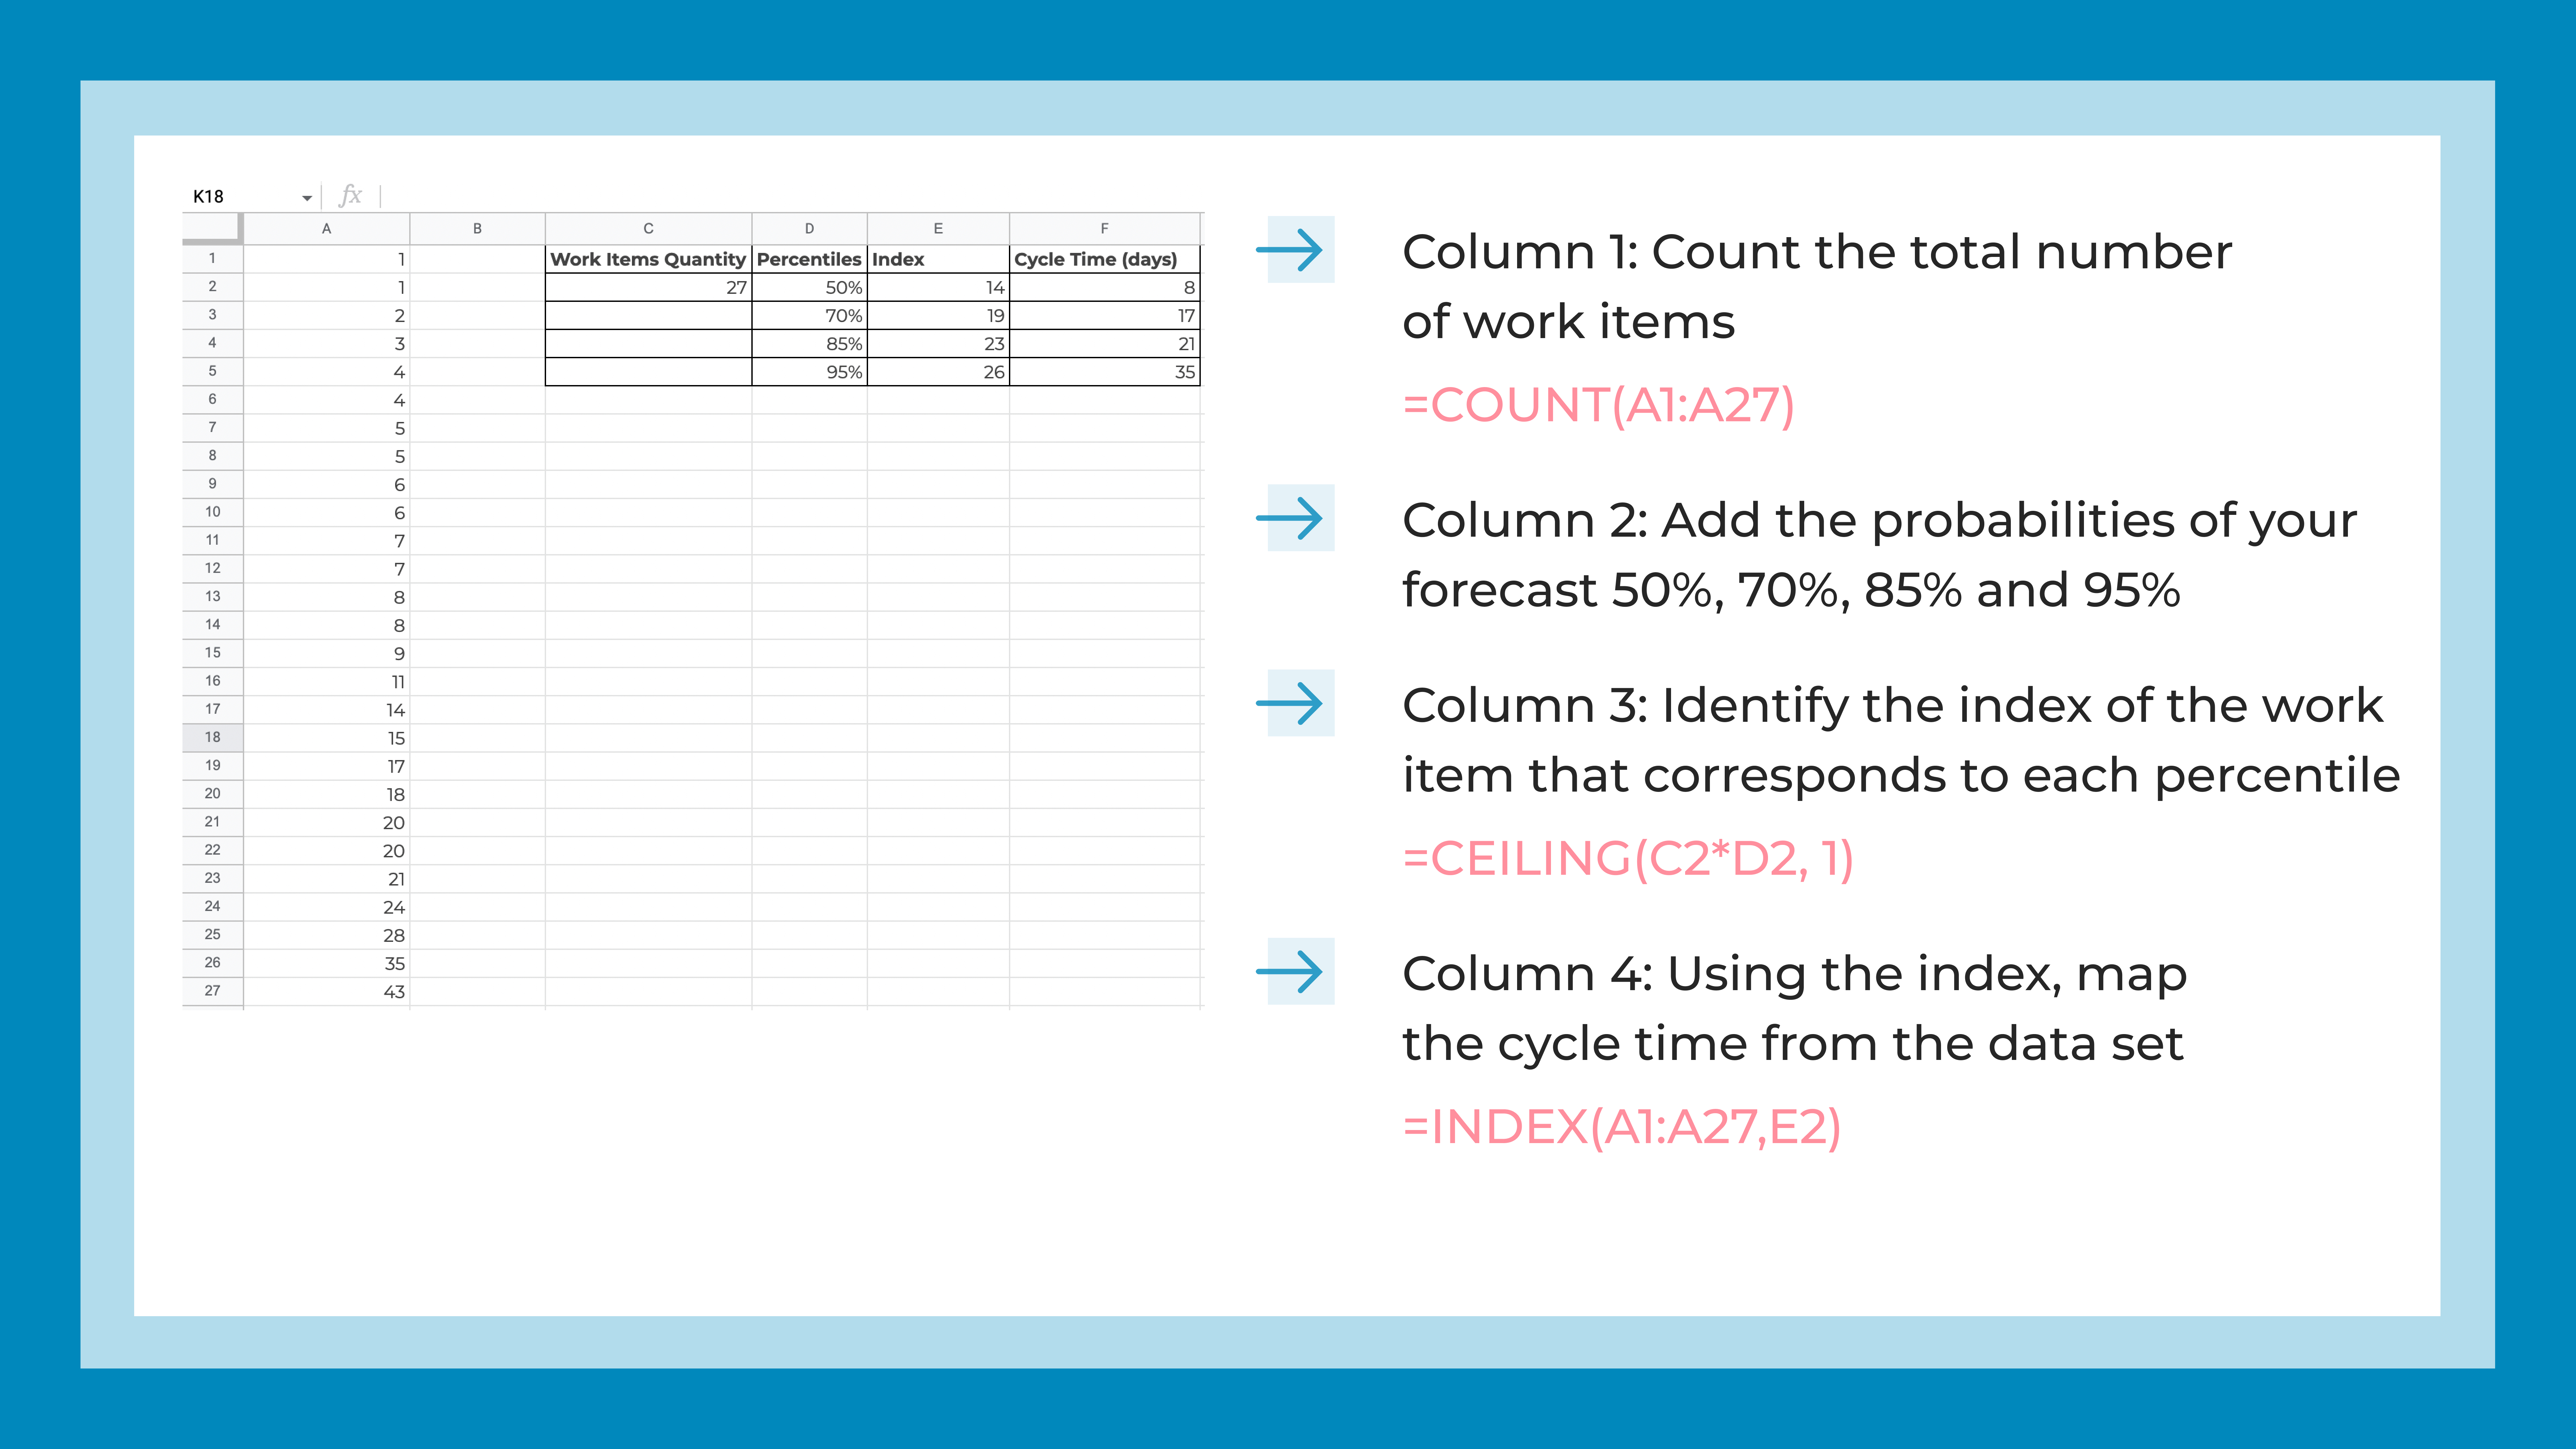 Now, in the third column, I want you to multiply the values from the first two columns so that we can identify the index of the work item that corresponds to each percentile.
In the example above, the 50% corresponds to the item with an index of 14, the 70% is the item with an index of 19, the 85th is the 23rd item and the 95th percent is the item with an index of 26.
In the fourth column, we map the cycle times that correspond to the indexes we’ve identified.
What we know now is that in 50% of the cases, we managed to deliver our work in LESS than 8 days. We can now say that with any future task we take on, there is a 50% chance of finishing that work item in LESS than 8 days.
Looking into the rest of the probabilities, we can also say that there is a 70% chance of finishing our work item in up to 17 days, an 85% probability that we’ll deliver in up to 21 days and a 95% chance of finishing our work in less than 35 days.
Well, we have officially made a forecast using our past performance data. Without knowing anything about the size of a task, we can make a commitment with a certain probability of meeting it.
How easy is that, right? You can use this approach to estimate the time your tasks will take in literally no time at all. You can make a copy of this spreadsheet here →
And if you’re already managing your work in Jira, Trello, Asana, Azure DevOps or even Excel, you can use the Cycle Time Scatterplot to calculate your time estimates automatically.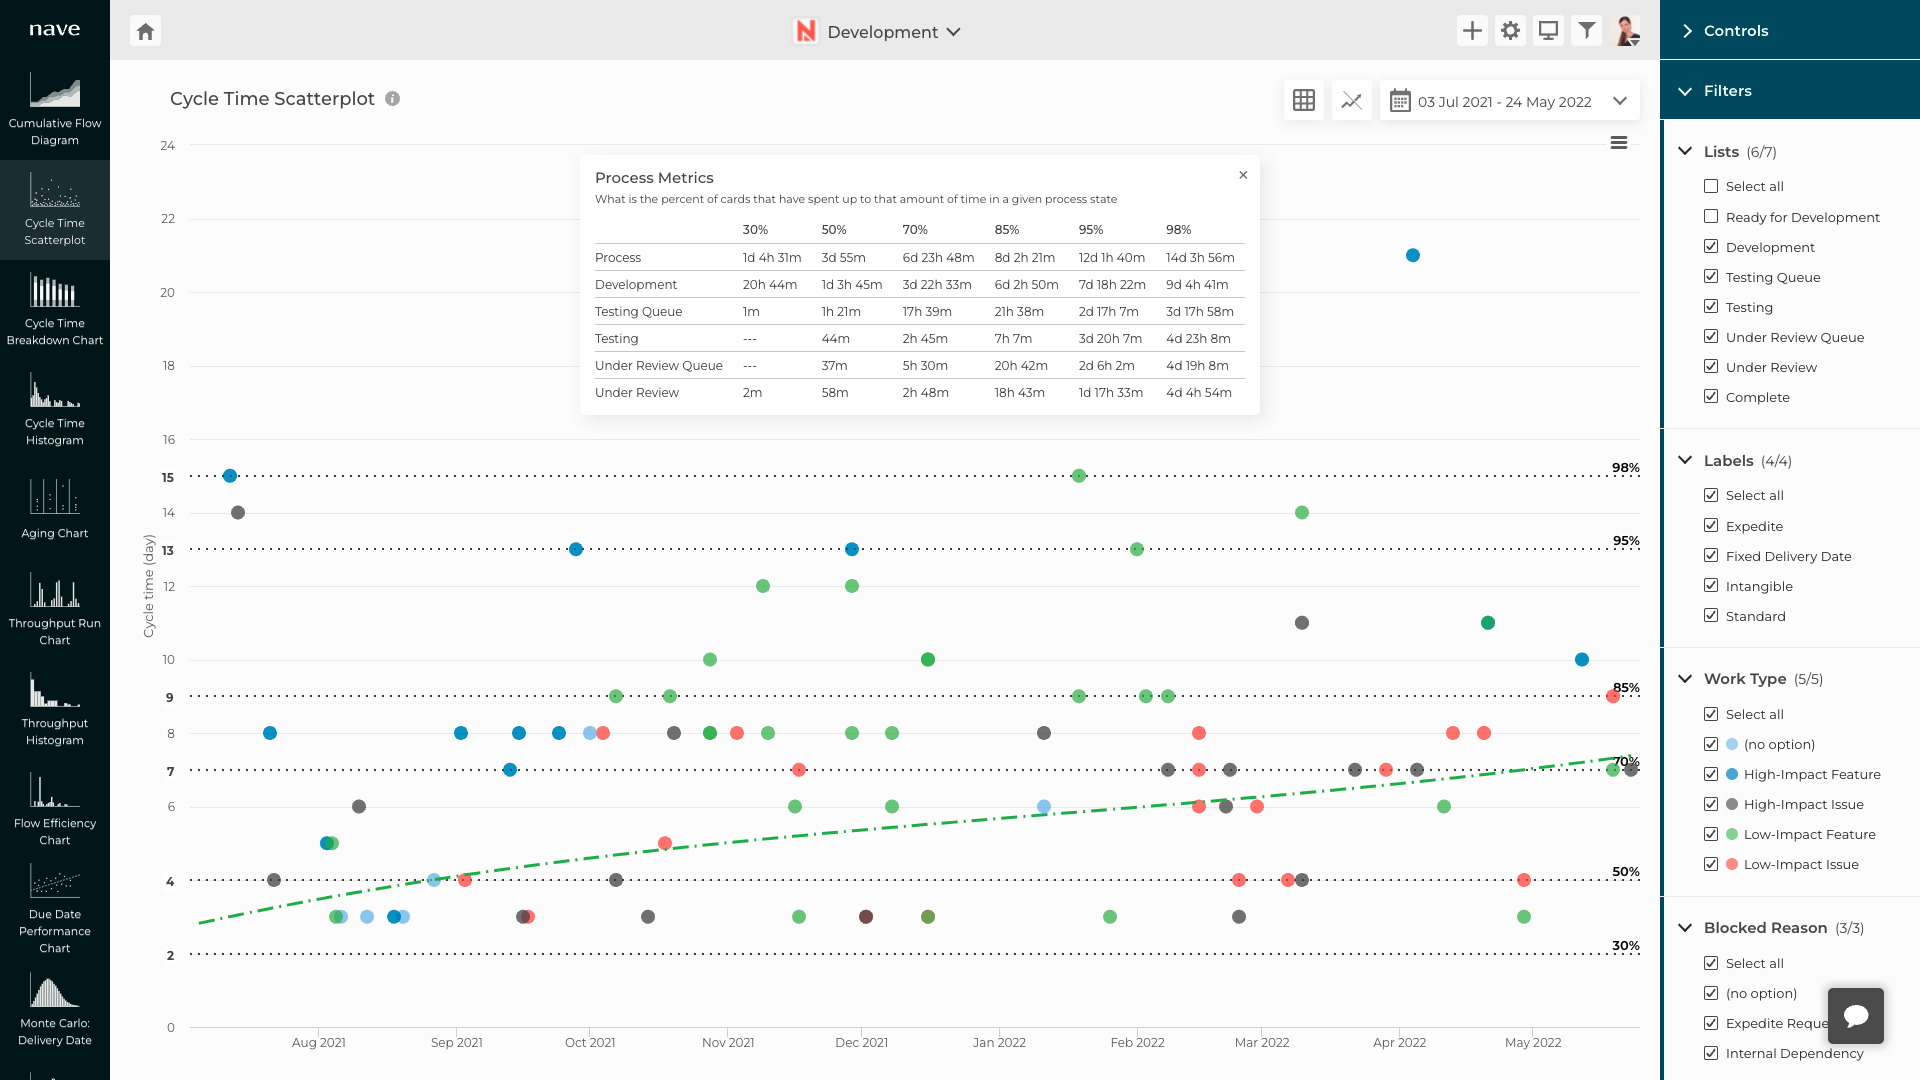 This chart visualizes all your completed tasks as dots scattered on a plot. Each task comes with the finish date and the time it has taken to complete.
The horizontal dotted lines stretching across the graph are called percentile lines. We use percentiles to understand how much time we need to finish our work.
These are exactly the same percentiles that we defined in our earlier exercise. You can create your dashboard and explore your data right now. Start a 14-day free trial here (no CC required!).
Now, making time estimates for the delivery of your projects is a little bit more complicated. For that purpose, we use Monte Carlo simulations to model the possible outcomes and the probabilities that come with each of them.
Regardless of whether you make a commitment to deliver a single task or a project, the most important thing to remember is that you can never and should never provide a single certain number.
Estimating is all about risk management. And the percentiles are here at your disposal to help you manage risks effectively.
Do we say that there is a 95% chance of completing the work in exactly 35 days? No, that’s not what we are saying. What we’re saying is that we’ll probably finish earlier but it won’t take us more than 35 days and we have a 95% certainty that we’ll hit that target!
Always remember that making time estimates are all about mitigating the risk of failure to fulfill our commitment. Now you know how to quantify that risk to make reliable data-driven decisions.
And as always, if you find this piece of content valuable, share it with any friends or colleagues who are struggling to deliver on their promises. My mission is to help as many leaders as I can hit their targets consistently. I’d be forever grateful if you spread the word.
Alright my friend, I hope you enjoyed this article. I’ll see you next week, same time, same place for more managerial goodness. Wishing you a productive day ahead!