Skip to content

Track Individual Project Progress

Drill down to the details of any project with task-level Gantt visualization. Move beyond high-level PSA status updates to truly understand project health. 

  • Monitor tasks within their project phases - See exactly where each project stands in its delivery lifecycle 
  • View task dependencies and critical paths - Understand which tasks must be completed before others can begin 
  • Track completion percentage with visual progress bars - Measure actual progress against planned progress at a glance 
  • Identify at-risk tasks before they impact deadlines - Spot and address bottlenecks weeks before they become client escalations

Visualize Your Entire Project Portfolio 

Get a bird's-eye view of all your active projects in one comprehensive timeline. Transform sprawling PSA project data into actionable visual insights. 

  • See all projects at a glance with color-coded timelines - Instantly understand which projects are on track, at risk, or behind schedule 
  • Identify resource conflicts across multiple projects - Spot and resolve overbooking issues before they become costly emergencies 
  • Understand dependencies between related projects - Visualize how delays in one project could impact others in your portfolio 
  • Adjust project timelines with simple drag-and-drop - Make changes in seconds that would take minutes or hours in your PSA 

Resource Allocation Made Easy 

Balance workloads and prevent bottlenecks with resource-focused views. End the constant juggling act of assigning the right resources to the right projects. 

  • See resource allocation across all projects - Understand exactly how your team's time is being utilized 
  • Identify overloaded resources before burnout occurs - Prevent technician turnover by spotting unrealistic workloads early 
  • Drag and drop to reassign tasks and balance workloads - Redistribute work in seconds, not hours 
  • Prevent scheduling conflicts with real-time availability insights - Never double-book your best engineers again 

What Customers Are Saying

sarah
star
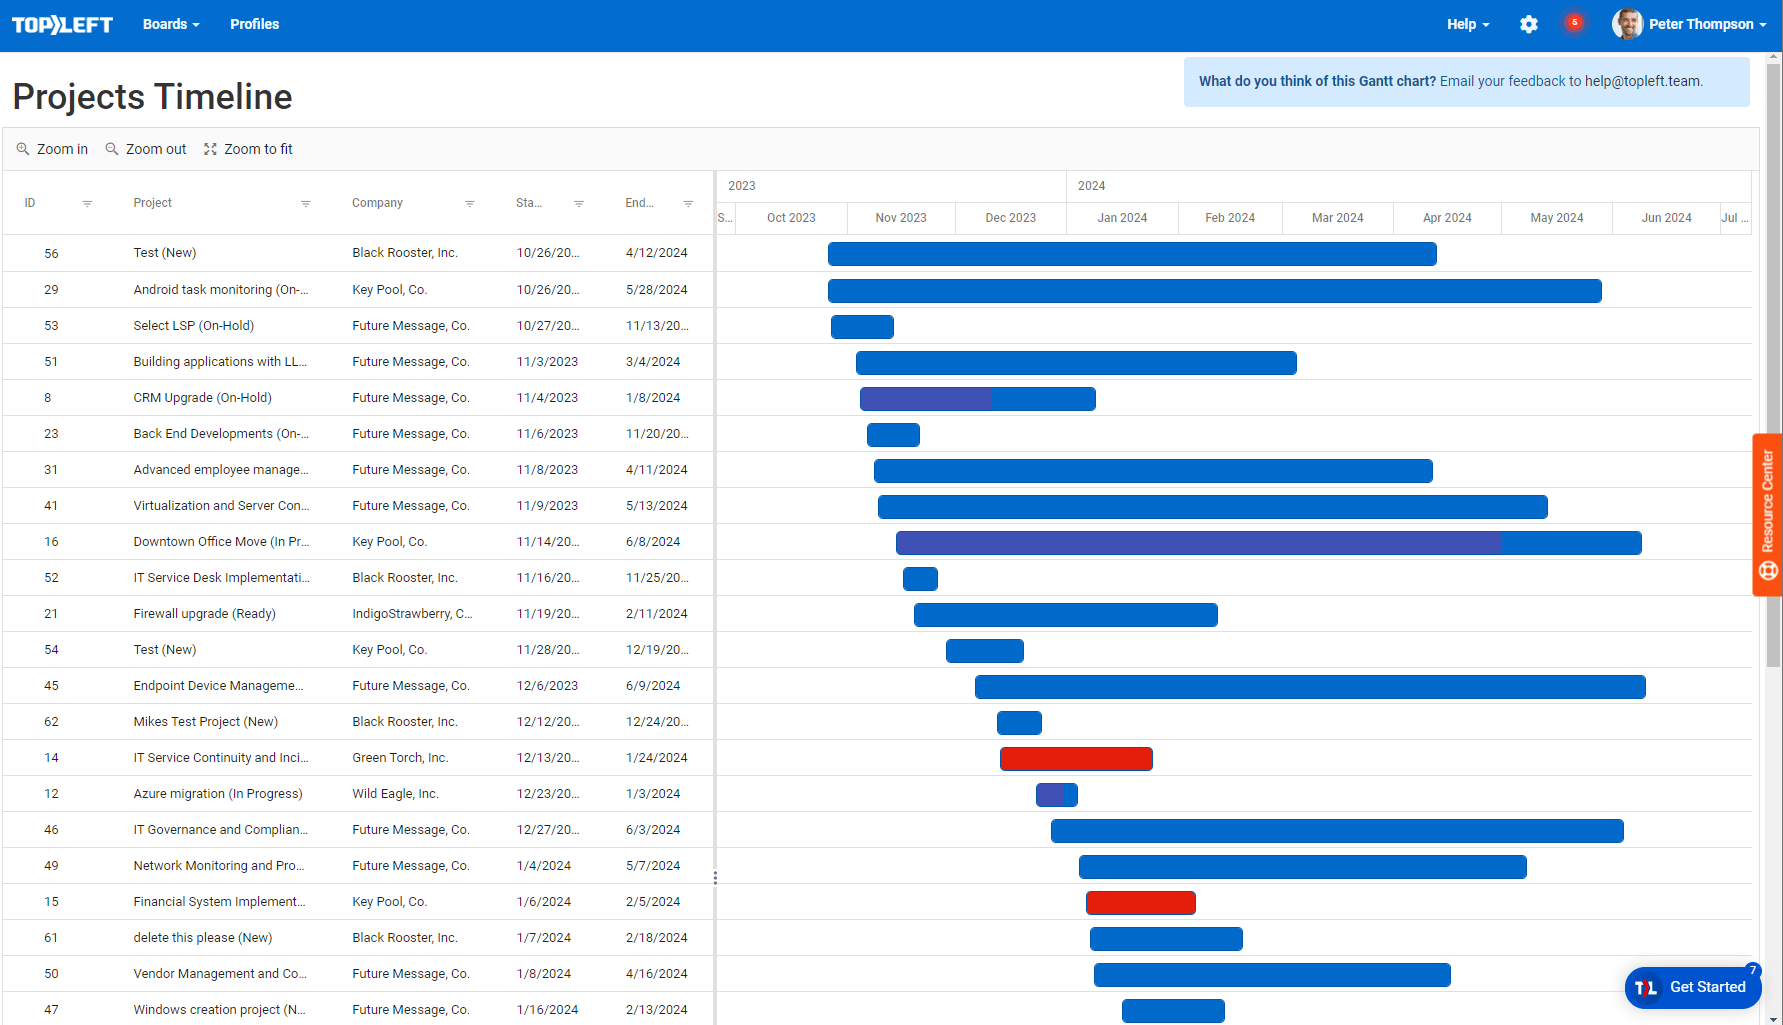
TopLeft turned project management from staring at huge, unprioritized lists into something visual and disgestible. Now we can see project timelines and tasks side-by-side, which is something we could not do before.
Sarah Ellis
CIO
Clear Guidance
frank hannaford
star
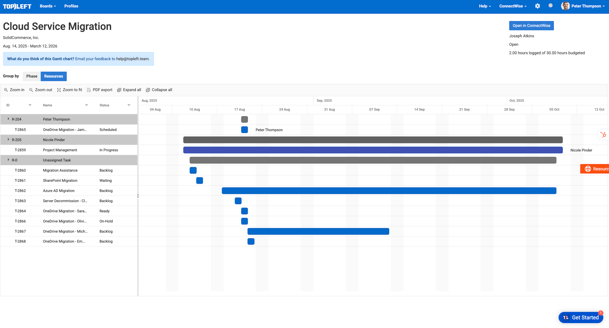
We simplified our entire ticket status system to just five Kanban swimlanes: backlog, blocked, ready, doing, done. No more 30 statuses. It’s clean, it’s fast, and everyone knows exactly where things stand.
Frank Hannaford
Solutions Architect
CoreTech

Frequently Asked Questions

Need help? See the answers to the most commonly asked questions below.

While Kanban boards excel at showing work status, distribution, and bottlenecks, they don't inherently display timeline relationships. Gantt charts complement this by visualizing the critical time dimension of projects. Together, these tools provide complete visibility into both work status and timeline progress. 


Yes! TopLeft's Gantt charts are fully interactive. Users with Engineer and Manager licenses can drag task bars to change start and end dates, extend durations, or reschedule entire projects. Viewer license holders can view all timeline information but cannot make changes. 

Task dependencies (predecessors) set in your PSA are automatically displayed in TopLeft Gantt charts. This makes it easy to see the relationships between tasks and understand the critical path of your project. Dependencies appear as arrows connecting related tasks. 


TopLeft Gantt charts use visual indicators to highlight progress and budget status. The dark portion of each task bar shows the percentage of budget used. When work exceeds the allocated budget, the bar turns red, providing an immediate visual cue that attention is needed. 


Yes, TopLeft's multi-project Gantt view allows you to see resource allocation across your entire project portfolio. This helps you identify overcommitted resources and potential bottlenecks before they impact your delivery timeline. 


TopLeft offers multiple ways to access Gantt charts: 

  • From a project board: click the timeline icon in the main menu 
  • From a project card: click the Gantt chart link 
  • From a project or phase swimlane: click the link in the swimlane header 


Yes, TopLeft Gantt charts include filtering options that allow you to focus on specific projects, phases, resources, or date ranges. This makes it easy to zoom in on exactly the information you need. 

Absolutely. All timeline data in TopLeft Gantt charts syncs bidirectionally with your PSA. Changes made in the Gantt view update your PSA, and changes made in your PSA appear in TopLeft in real-time. 

Yes, TopLeft makes it easy to share Gantt charts with stakeholders. You can export charts as PDFs, share direct links with team members who have TopLeft access, or display them during client meetings for transparent progress updates. 

Implementation is immediate. As soon as you connect TopLeft to your PSA, your project and task data is available in Gantt format. There's no additional setup required beyond your existing PSA configuration. 

Request a Consultation

See how TopLeft's Gantt Charts Can Decrease Your MSP's Project Completion Time Significantly