![How to Read the Cumulative Flow Diagram [Infographic]](https://www.topleft.team/hs-fs/hubfs/Imported_Blog_Media/cumulative-flow-diagram-metrics-980x590.jpeg?width=795&height=497&name=cumulative-flow-diagram-metrics-980x590.jpeg)
The Kanban Method can help teams manage their workflows more efficiently but relying on your Kanban board alone isn’t going to help you achieve a stable process. You also need a way to identify bottlenecks and stabilize your workflow using data visualization tools. In this infographic, we’ll be explaining how to do that with the cumulative flow diagram.
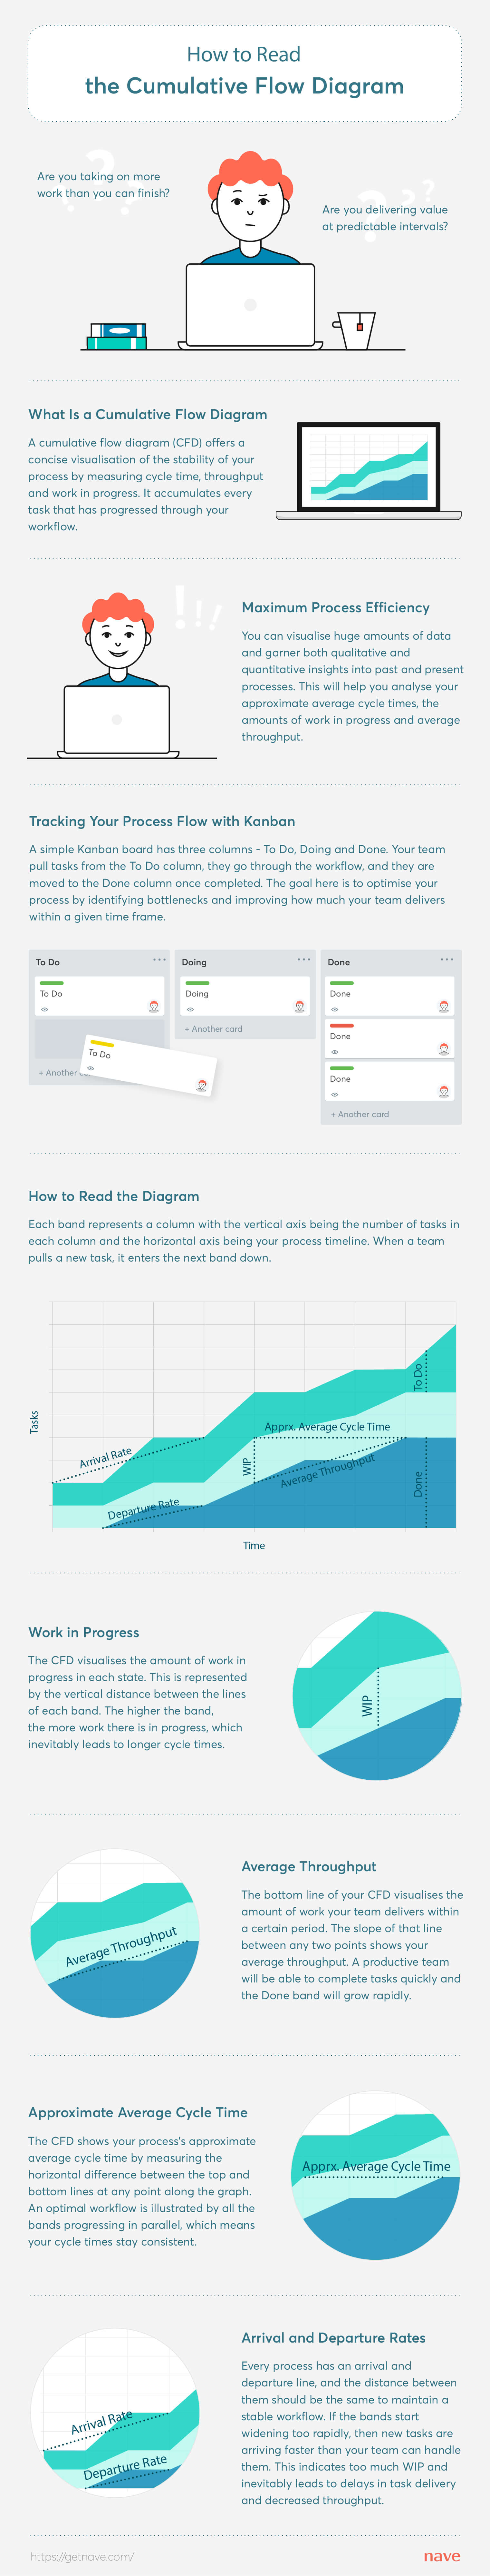
The Kanban Method is built around optimizing cycle times, limiting WIP, and continuously delivering. There is a lot of critical flow information that can be drawn from the CFD at a glance.
The fundamental purpose of the cumulative flow diagram is to demonstrate the stability of your workflow. Analysis of the CFD should tell you what areas need your focus, in order to maintain continuous process improvement. It enables you to improve your overall productivity and efficiency.
If you have used cumulative flow diagrams within your team, we’d love to hear what effect they had on your performance. Share your story in the comments below!